Unlock a world of possibilities! Login now and discover the exclusive benefits awaiting you.
- Qlik Community
- :
- All Forums
- :
- QlikView App Dev
- :
- Re: Complex Time dimension
- Subscribe to RSS Feed
- Mark Topic as New
- Mark Topic as Read
- Float this Topic for Current User
- Bookmark
- Subscribe
- Mute
- Printer Friendly Page
- Mark as New
- Bookmark
- Subscribe
- Mute
- Subscribe to RSS Feed
- Permalink
- Report Inappropriate Content
Complex Time dimension
Hello,
I have to build a chart like the one picture.
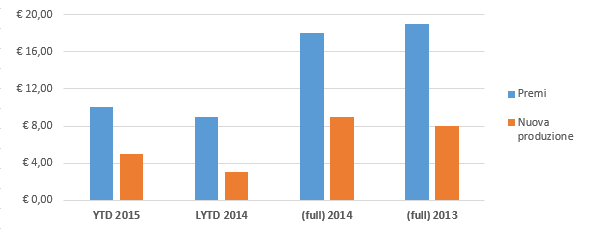
Time dimension (on x axis) is dynamic and it has 4 elements YTD, Last YTD, Full Last Year, Full two Last Year.
Users can change month and year of analysis.
How can I build this dimension? Calculated dimension?
Thanks.
- Mark as New
- Bookmark
- Subscribe
- Mute
- Subscribe to RSS Feed
- Permalink
- Report Inappropriate Content
Hi Luca,
The solution can be:
1. To use Alternate States (vers. 11+) in the chart - to avoid any change of the data according the user selection.
2. For calculate value in the chart use Set Analysis function:
Current Year - Sum( {$ <CalYear={ $(=max(CalYear)) }>} SalesAmount)
LYTD - Sum( {$ <CalYear={ $(=max(CalYear)) }>} SalesAmount*_FLAGLYTD)
Full last Year - Sum( {$ <CalYear={$(=max(CalYear)-1)}>} SalesAmount)
Full two Year - Sum( {$ <CalYear={$(=max(CalYear)-2)}>} SalesAmount)
_FLAGLYTD =inyeartodate (DataSales, Today(), -1 ) - calculated in scrip.
Hope help you!
- Mark as New
- Bookmark
- Subscribe
- Mute
- Subscribe to RSS Feed
- Permalink
- Report Inappropriate Content
I guess its possible.Let me give a try ,if u can provide some sample data.
- Mark as New
- Bookmark
- Subscribe
- Mute
- Subscribe to RSS Feed
- Permalink
- Report Inappropriate Content
assuming you had a YTD flag in the script you could do something like below:
Dimension:
Calculated: =Valuelist('YTD 2014', 'LYTD 2015', '(full)2014', '(full)2013')
Expression: 1 long IF statement
If(Valuelist('YTD 2015', 'LYTD 2014', '(full)2014', '(full)2013') = 'YTD 2015',
Sum({$<Year={$(=Max(Year))}, YTDFlag={1}>} Sales),
If(Valuelist('YTD 2015', 'LYTD 2014', '(full)2014', '(full)2013') = 'LYTD 2014',
Sum({$<Year={$(=Max(Year)-1)}, YTDFlag={1}>} Sales),
if(Valuelist('YTD 2015', 'LYTD 2014', '(full)2014', '(full)2013') = '(full)2014',
Sum({$<Year={$(=Max(Year)-1)}>} Sales),
f(Valuelist('YTD 2015', 'LYTD 2014', '(full)2014', '(full)2013') = '(full)2013',
Sum({$<Year={$(=Max(Year)-2)}>} Sales)))))
They would still be able to make month and year selections.
- Mark as New
- Bookmark
- Subscribe
- Mute
- Subscribe to RSS Feed
- Permalink
- Report Inappropriate Content
thank you jpapador, you found the solution! 