Unlock a world of possibilities! Login now and discover the exclusive benefits awaiting you.
- Qlik Community
- :
- All Forums
- :
- QlikView App Dev
- :
- Complex display in a chart (only one value to disp...
- Subscribe to RSS Feed
- Mark Topic as New
- Mark Topic as Read
- Float this Topic for Current User
- Bookmark
- Subscribe
- Mute
- Printer Friendly Page
- Mark as New
- Bookmark
- Subscribe
- Mute
- Subscribe to RSS Feed
- Permalink
- Report Inappropriate Content
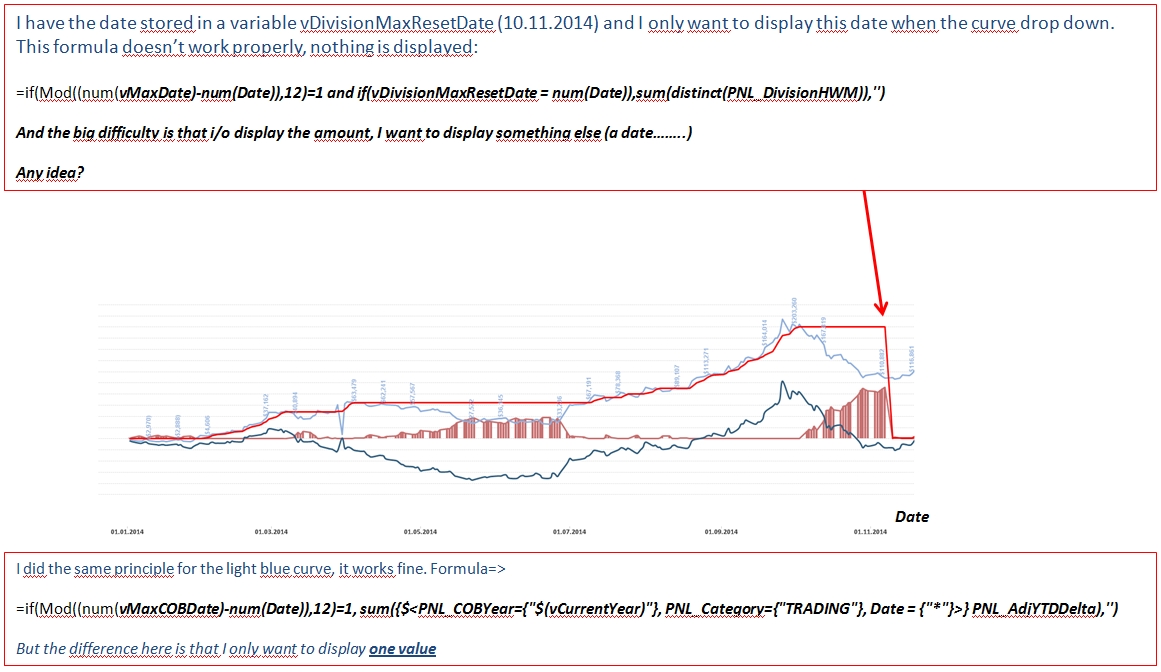
Complex display in a chart (only one value to display)
Good morning,
As per screenshot here below, I need to display only one value, at a certain point, but not a value of the curve! But a date!
How can I manage that?
Thanks a lot,
Michaël.
Ce message a été modifié par : Michaël REMILLIER
- Mark as New
- Bookmark
- Subscribe
- Mute
- Subscribe to RSS Feed
- Permalink
- Report Inappropriate Content
Can you post a .qvw document that demonstrates the problem?
talk is cheap, supply exceeds demand
- Mark as New
- Bookmark
- Subscribe
- Mute
- Subscribe to RSS Feed
- Permalink
- Report Inappropriate Content
Done Gysbert Thank you. My objective is to display the Date when the red curve fall down.
- Mark as New
- Bookmark
- Subscribe
- Mute
- Subscribe to RSS Feed
- Permalink
- Report Inappropriate Content
See attached qvw.
talk is cheap, supply exceeds demand
- Mark as New
- Bookmark
- Subscribe
- Mute
- Subscribe to RSS Feed
- Permalink
- Report Inappropriate Content
Thank you very much Gysbert, but when I want to reproduce what you did, all values displayed along the light blue curve are disappearing and I still can't see the max date displayed..........don't you have any idea? Don't know why I can't reproduce what you did properly.