Unlock a world of possibilities! Login now and discover the exclusive benefits awaiting you.
Announcements
FLASH SALE: Save $500! Use code FLASH2026 at checkout until Feb 14th at 11:59PM ET. Register Now!
- Qlik Community
- :
- All Forums
- :
- QlikView App Dev
- :
- Re: Compounded Expression in Line Chart
Options
- Subscribe to RSS Feed
- Mark Topic as New
- Mark Topic as Read
- Float this Topic for Current User
- Bookmark
- Subscribe
- Mute
- Printer Friendly Page
Turn on suggestions
Auto-suggest helps you quickly narrow down your search results by suggesting possible matches as you type.
Showing results for
Contributor
2015-11-26
03:58 AM
- Mark as New
- Bookmark
- Subscribe
- Mute
- Subscribe to RSS Feed
- Permalink
- Report Inappropriate Content
Compounded Expression in Line Chart
Hi,
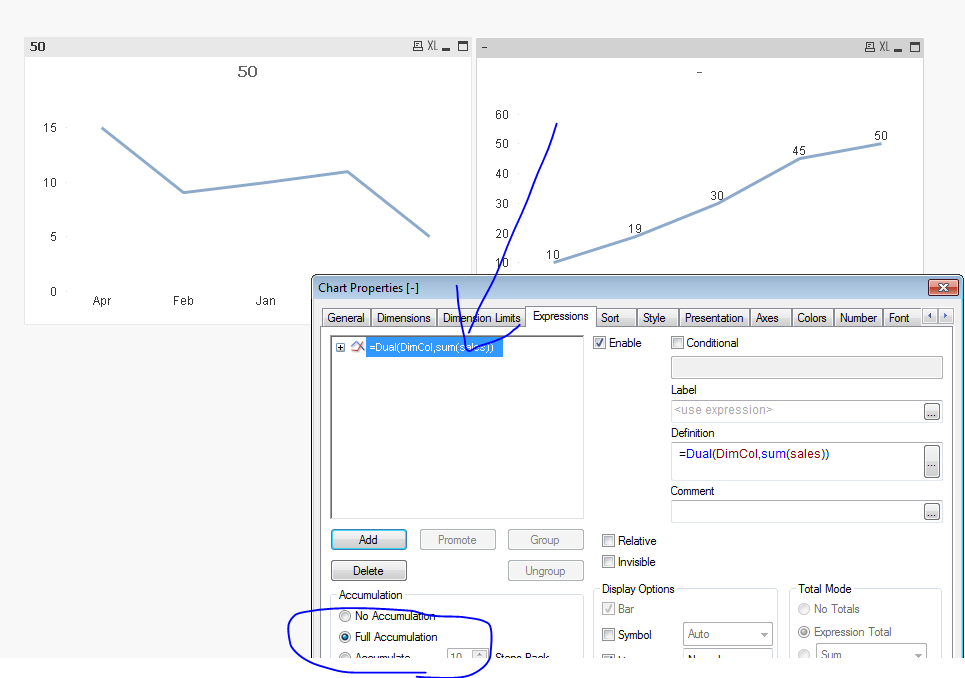
I'm trying to create a line chart that has a compounded expression. For example, I have the following data
Jan - 10
Feb - 9
Mar - 11
Apr - 15
May - 5
What I want to show in the chart are the following values
Jan - 10
Feb - 19
Mar = 30
Apr - 45
May - 50
So this will effectively create a line that always curves up. Any ideas how this can be achieved?
586 Views
1 Solution
Accepted Solutions
Partner - Champion III
2015-11-26
05:14 AM
- Mark as New
- Bookmark
- Subscribe
- Mute
- Subscribe to RSS Feed
- Permalink
- Report Inappropriate Content
Enable the Full Accumulation option for the expression. Or use something like rangesum(above(sum(Value),0,rowno())) as expression.
talk is cheap, supply exceeds demand
2 Replies
Partner - Champion III
2015-11-26
05:14 AM
- Mark as New
- Bookmark
- Subscribe
- Mute
- Subscribe to RSS Feed
- Permalink
- Report Inappropriate Content
Enable the Full Accumulation option for the expression. Or use something like rangesum(above(sum(Value),0,rowno())) as expression.
talk is cheap, supply exceeds demand
Master II
2015-11-26
05:41 AM
- Mark as New
- Bookmark
- Subscribe
- Mute
- Subscribe to RSS Feed
- Permalink
- Report Inappropriate Content
use this,
549 Views