Unlock a world of possibilities! Login now and discover the exclusive benefits awaiting you.
- Qlik Community
- :
- All Forums
- :
- QlikView App Dev
- :
- Re: Conditional Based Graphs display in QlikView
- Subscribe to RSS Feed
- Mark Topic as New
- Mark Topic as Read
- Float this Topic for Current User
- Bookmark
- Subscribe
- Mute
- Printer Friendly Page
- Mark as New
- Bookmark
- Subscribe
- Mute
- Subscribe to RSS Feed
- Permalink
- Report Inappropriate Content
Conditional Based Graphs display in QlikView
Hi All,
I have a requirement is that, need to display the graphs with different colors based on some conditions like
Take an issue completion percentage graph:
1. For percentage below 100% need to be blue
2. For percentage exactly 100% need to be green
3. For percentage above 100% need to be Red.
Can any one help me out to solving the same.
Thanks & Regards,
Sasi
- « Previous Replies
-
- 1
- 2
- Next Replies »
- Mark as New
- Bookmark
- Subscribe
- Mute
- Subscribe to RSS Feed
- Permalink
- Report Inappropriate Content
Hi,
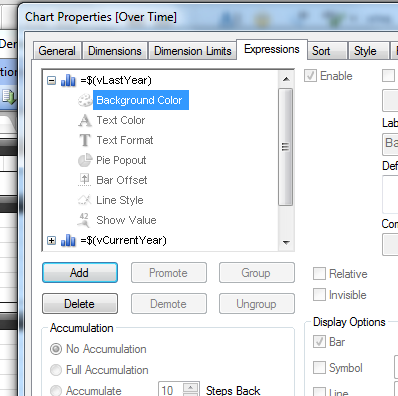
On chart properties you can change background color of your expression:

On definition you can write:
If(value<1,
Blue(),
If(value=1,
Green(),
Red()
)
)
Regards
Aurélien
- Mark as New
- Bookmark
- Subscribe
- Mute
- Subscribe to RSS Feed
- Permalink
- Report Inappropriate Content
Hi Thanks for your quick reply..
Will try now and let you know..
Thanks
- Mark as New
- Bookmark
- Subscribe
- Mute
- Subscribe to RSS Feed
- Permalink
- Report Inappropriate Content
Hi Aurélien,
As mentioned used the below mentioned condition:
if ([Nov-13]>100, RGB(255,0,0))
But was unable to get the color change for values above 100.
Can you please let me know any other options.
Thanks in advance for your support
- Mark as New
- Bookmark
- Subscribe
- Mute
- Subscribe to RSS Feed
- Permalink
- Report Inappropriate Content
I have also same issue with my chart !
Please post if you got proper solution.
Thanks
Vikas
If the issue is solved please mark the answer with Accept as Solution & like it.
If you want to go quickly, go alone. If you want to go far, go together.
- Mark as New
- Bookmark
- Subscribe
- Mute
- Subscribe to RSS Feed
- Permalink
- Report Inappropriate Content
Hi Vikas,
Tried the above mentioned condition, but was unable to get the requirement.
Will let you know once if i found any solution . If you got it please let me know.
Thanks & Regards,
Sasi
- Mark as New
- Bookmark
- Subscribe
- Mute
- Subscribe to RSS Feed
- Permalink
- Report Inappropriate Content
Can you post a application?
if ([Nov-13]>100,
RGB(255,0,0),
if(if ([Nov-13]=100,
RGB(0,255,0),
RGB(0,0,255)
)
)
- Mark as New
- Bookmark
- Subscribe
- Mute
- Subscribe to RSS Feed
- Permalink
- Report Inappropriate Content
Hello!
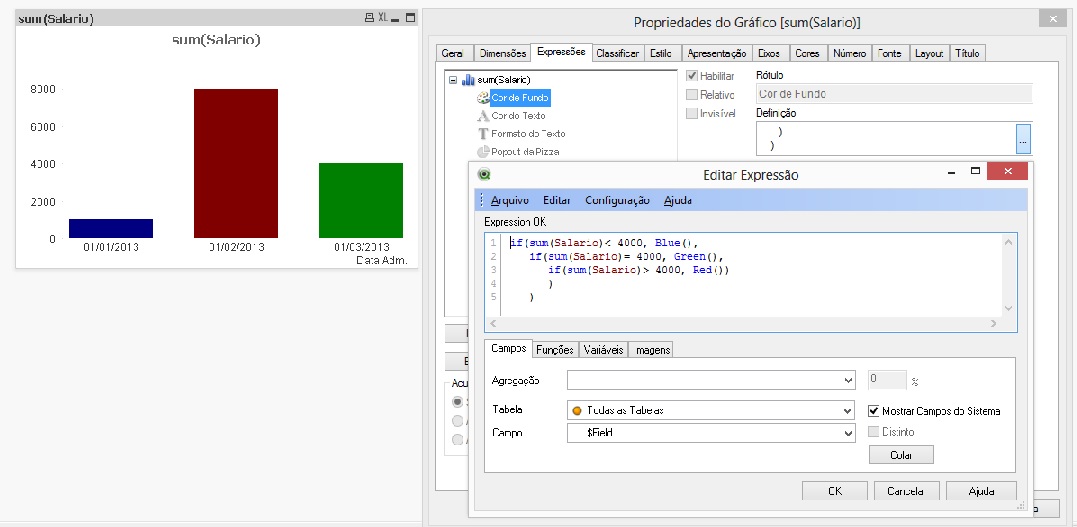
Try it:

- Mark as New
- Bookmark
- Subscribe
- Mute
- Subscribe to RSS Feed
- Permalink
- Report Inappropriate Content
Hi,
Tried the same. But was able to get only 2 conditions based color.
Thanks & Regards,
Sasi
- Mark as New
- Bookmark
- Subscribe
- Mute
- Subscribe to RSS Feed
- Permalink
- Report Inappropriate Content
Good night!
If the solution that you've is correct, let others know that, to use the same solution, marking my answer as correct.
Thank you!
- « Previous Replies
-
- 1
- 2
- Next Replies »