Unlock a world of possibilities! Login now and discover the exclusive benefits awaiting you.
- Qlik Community
- :
- All Forums
- :
- QlikView App Dev
- :
- Re: Conditional Expression on Stacked Chart
- Subscribe to RSS Feed
- Mark Topic as New
- Mark Topic as Read
- Float this Topic for Current User
- Bookmark
- Subscribe
- Mute
- Printer Friendly Page
- Mark as New
- Bookmark
- Subscribe
- Mute
- Subscribe to RSS Feed
- Permalink
- Report Inappropriate Content
Conditional Expression on Stacked Chart
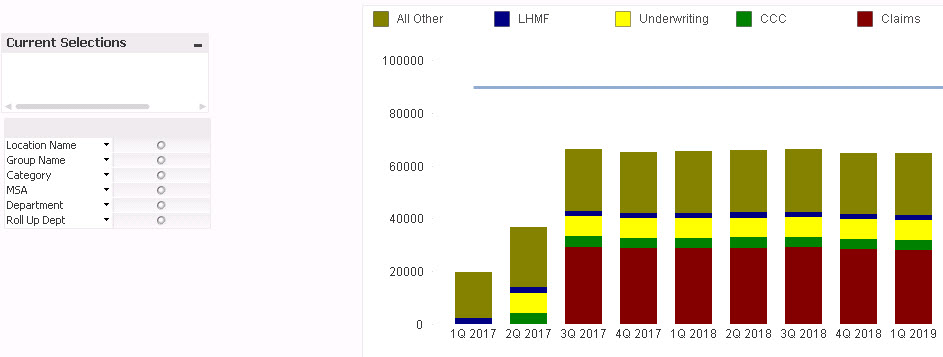
I have a stacked bar chart where my dimension is Quarter and my Expressions are totals of various departments (Claims, Underwriting, etc.) When a user selects a Department from the multi box, I'd like the chart to change and just show the department selected. The default (no selections) would show all Departments.
From this:

To This:

I accomplished this using WildMatch(Concat([Roll-Up Dept],'/'),'Claims') but it has a couple problems. The default view is an empty chart. You have to select a Dept to view it. I'd like the default to show all depts. (the full stack like above). And it won't let me select multiple depts. I've seen this work on a table but can't get it to work on the stacked chart. Any help would be greatly appreciated!
Accepted Solutions
- Mark as New
- Bookmark
- Subscribe
- Mute
- Subscribe to RSS Feed
- Permalink
- Report Inappropriate Content
I would suggest to use The Crosstable Load to convert each department into a single column.... but with your current structure, you can use this for your conditional expressions.... for instance for Sum(Claims), use this:
=SubStringCount(Concat(DISTINCT '|' &[Roll-up Dept]) & '|', '|Claims|')
- Mark as New
- Bookmark
- Subscribe
- Mute
- Subscribe to RSS Feed
- Permalink
- Report Inappropriate Content
What is your expression
- Mark as New
- Bookmark
- Subscribe
- Mute
- Subscribe to RSS Feed
- Permalink
- Report Inappropriate Content
Are you using set analysis on Department field? If you are, then you might need an asterisk before your equal sign
Sum({<Department *= {...}>}Measure)
- Mark as New
- Bookmark
- Subscribe
- Mute
- Subscribe to RSS Feed
- Permalink
- Report Inappropriate Content
The expressions are Sum(Claims), Sum(Underwriting), etc. to make up the individual parts of the stack
- Mark as New
- Bookmark
- Subscribe
- Mute
- Subscribe to RSS Feed
- Permalink
- Report Inappropriate Content
No b/c each expression is a dept itself. Sum(Claims), Sum(Underwriting), Sum(CCC)
- Mark as New
- Bookmark
- Subscribe
- Mute
- Subscribe to RSS Feed
- Permalink
- Report Inappropriate Content
I would suggest to use The Crosstable Load to convert each department into a single column.... but with your current structure, you can use this for your conditional expressions.... for instance for Sum(Claims), use this:
=SubStringCount(Concat(DISTINCT '|' &[Roll-up Dept]) & '|', '|Claims|')
- Mark as New
- Bookmark
- Subscribe
- Mute
- Subscribe to RSS Feed
- Permalink
- Report Inappropriate Content
This worked perfectly! Thank you so much!