Unlock a world of possibilities! Login now and discover the exclusive benefits awaiting you.
- Qlik Community
- :
- All Forums
- :
- QlikView App Dev
- :
- Re: Conditional Numbering AutoNumbering
- Subscribe to RSS Feed
- Mark Topic as New
- Mark Topic as Read
- Float this Topic for Current User
- Bookmark
- Subscribe
- Mute
- Printer Friendly Page
- Mark as New
- Bookmark
- Subscribe
- Mute
- Subscribe to RSS Feed
- Permalink
- Report Inappropriate Content
Conditional Numbering AutoNumbering
Hi Guys. I have a situation where I have projects which runs during different time periods and I would want to plot the results of the project on a line chart for comparison. For me to be able to do this I would want the start for each period to be either Week 1 or Day 1 and then start Automatically numbering the time period from that to the end date of the period. How do I create expressions for this type of requirement in the load script?
Example data
| DATE | Project | Units |
| 03/08/2016 | Project A | 50 |
| 04/08/2016 | Project A | 30 |
| 05/08/2016 | Project A | 20 |
| 06/08/2016 | Project A | 40 |
| 07/08/2016 | Project A | 90 |
| 08/08/2016 | Project A | 20 |
| 09/08/2016 | Project A | 15 |
| 10/08/2016 | Project A | 22 |
| 11/08/2016 | Project A | 10 |
| 12/08/2016 | Project A | 100 |
| 13/08/2016 | Project A | 20 |
| 14/08/2016 | Project A | 65 |
| 15/08/2016 | Project A | 77 |
| 16/08/2016 | Project A | 88 |
| 17/08/2016 | Project A | 105 |
| 06/09/2016 | Project B | 120 |
| 07/09/2016 | Project B | 130 |
| 08/09/2016 | Project B | 90 |
| 09/09/2016 | Project B | 70 |
| 10/09/2016 | Project B | 69 |
| 11/09/2016 | Project B | 87 |
| 12/09/2016 | Project B | 39 |
| 13/09/2016 | Project B | 45 |
| 14/09/2016 | Project B | 56 |
| 15/09/2016 | Project B | 60 |
| 16/09/2016 | Project B | 70 |
Accepted Solutions
- Mark as New
- Bookmark
- Subscribe
- Mute
- Subscribe to RSS Feed
- Permalink
- Report Inappropriate Content
- Mark as New
- Bookmark
- Subscribe
- Mute
- Subscribe to RSS Feed
- Permalink
- Report Inappropriate Content
Hi Rungano,
If the result you need is similar to below:
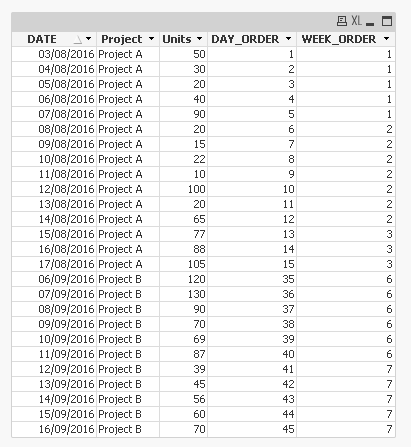
, look at the attached app.
Regards,
H
- Mark as New
- Bookmark
- Subscribe
- Mute
- Subscribe to RSS Feed
- Permalink
- Report Inappropriate Content
Hi Hector
The results that I want is when we start Project B then It start to re-count Day 1 and also week 1.
- Mark as New
- Bookmark
- Subscribe
- Mute
- Subscribe to RSS Feed
- Permalink
- Report Inappropriate Content
OK,
Try the attached app.
Regards,
H
- Mark as New
- Bookmark
- Subscribe
- Mute
- Subscribe to RSS Feed
- Permalink
- Report Inappropriate Content
Something like this (adapted to suit your load script):
LOAD
DATE,
Project,
Units,
AutoNumber(DATE, Project) as SequenceByProject
FROM ...