Unlock a world of possibilities! Login now and discover the exclusive benefits awaiting you.
- Qlik Community
- :
- All Forums
- :
- QlikView App Dev
- :
- Re: Conditional chart (plain table) output
- Subscribe to RSS Feed
- Mark Topic as New
- Mark Topic as Read
- Float this Topic for Current User
- Bookmark
- Subscribe
- Mute
- Printer Friendly Page
- Mark as New
- Bookmark
- Subscribe
- Mute
- Subscribe to RSS Feed
- Permalink
- Report Inappropriate Content
Conditional chart (plain table) output
I have a table of CID (Company ID), StartDate, EndDate (containing start and end of insurance contracts). My plain table chart should have a list of companies (CIDs) that don't have any insurance on a desired date (taken from a variable set by input box). I've taken CID as a Dimension and CID and
Count({$<[StartDate]={"<=$(TargetDate)"},[EndDate]={">=$(TargetDate)"}>}Distinct CID)
as Expressions. How can I limit the the counted expression to be displayed by the ">0"? And, by the way, what does "Conditional" oprion in expressions do? I failed to find any info in the manuals and could not understand the logic of setting it. Thanks in advance!
- « Previous Replies
-
- 1
- 2
- Next Replies »
- Mark as New
- Bookmark
- Subscribe
- Mute
- Subscribe to RSS Feed
- Permalink
- Report Inappropriate Content
The conditional option for expression is to add an expression that should return 0 to hide the expression column or any number other than 0 to show the expression column. It's used for example to let users choose the dimensions and/or metrics to show in a straight table. See this blog post for an explanation: Customizable Straight Table
If you want to suppress counts of 0 then enable the option Suppress Zero-Values on the Presentation tab of the chart. As long as you have only one expression in your chart this is enough to hide all CID's with a count of 0.
talk is cheap, supply exceeds demand
- Mark as New
- Bookmark
- Subscribe
- Mute
- Subscribe to RSS Feed
- Permalink
- Report Inappropriate Content
What is the difference between "Conditional" on the Expression sheet and "Conditional" on the Presentation sheet?
I have the Supress Zero-Values set by default, but it doesn't hide zeroes on the chart. What am I doing wrong?
Is there a more general way to filter the values?
- Mark as New
- Bookmark
- Subscribe
- Mute
- Subscribe to RSS Feed
- Permalink
- Report Inappropriate Content
Hi,
"Conditional" on the Expression sheet allows to hide or show just the expression you're applying a conditional. On the other hand "Conditional" on the presentation sheet lets you hide/show the entire object. So, basically the difference is the scope of conditional,
regards
- Mark as New
- Bookmark
- Subscribe
- Mute
- Subscribe to RSS Feed
- Permalink
- Report Inappropriate Content
What do you mean by saying "...lets you hide/show the entire object..." ? What object? A whole chart? If so, it is doubtful as there are separate "Conditional"s on the Presentation sheet for each column. Each of them hide the respective column.
- Mark as New
- Bookmark
- Subscribe
- Mute
- Subscribe to RSS Feed
- Permalink
- Report Inappropriate Content
What it means is that there are different levels or scopes for conditionals:
- Conditional for sheets (tabs)
- Conditional for objects (an object is a whole chart, straight table, pivot table, list box, etc)
- Conditional for columns inside charts (for example you can hide or show just some columns of a straight table depending on certain conditions)
That's why the conditional option appears in different places, because they refer to different things,
hope that helps,
regards
- Mark as New
- Bookmark
- Subscribe
- Mute
- Subscribe to RSS Feed
- Permalink
- Report Inappropriate Content
OK. But setting the Presentation/conditional does not hide the whole object (chart). It hides column only. You said: ""Conditional" on the presentation sheet lets you hide/show the entire object". What's wrong with my chart/hands/brain/etc? 😉
- Mark as New
- Bookmark
- Subscribe
- Mute
- Subscribe to RSS Feed
- Permalink
- Report Inappropriate Content
PARTIALLY solved for me: Chart Properties - Dimension Limits - (check) Restrict which values... - Show only values... (see screen attached). But I don't like the solution because it gives too little flexibility choosing the desired condition of showing/hiding records actually narrowed to only basic math operations. Is any way to alter it and have full featured condition? Something like "HAVING" clause in SQL.
- Mark as New
- Bookmark
- Subscribe
- Mute
- Subscribe to RSS Feed
- Permalink
- Report Inappropriate Content
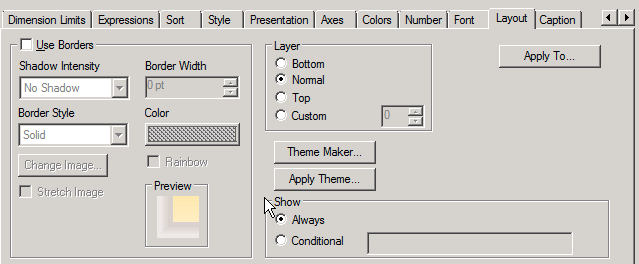
Yeah it was my mistake, the conditional that hides the whole object is located in layout tab:
- Mark as New
- Bookmark
- Subscribe
- Mute
- Subscribe to RSS Feed
- Permalink
- Report Inappropriate Content
It looks like you have CID defined as an expression column as well? If so it will return a non-zero value. "Suppress Zero Values" only suppresses rows where all expression values are zero, whether those columns are hidden or shown.
(A column hidden on the Presentation tab still exists. A column suppressed by the Conditional property on the Expressions tab does not exist.)
-Rob
- « Previous Replies
-
- 1
- 2
- Next Replies »