Unlock a world of possibilities! Login now and discover the exclusive benefits awaiting you.
- Qlik Community
- :
- All Forums
- :
- QlikView App Dev
- :
- Conditional formatting and comparison with the med...
- Subscribe to RSS Feed
- Mark Topic as New
- Mark Topic as Read
- Float this Topic for Current User
- Bookmark
- Subscribe
- Mute
- Printer Friendly Page
- Mark as New
- Bookmark
- Subscribe
- Mute
- Subscribe to RSS Feed
- Permalink
- Report Inappropriate Content
Conditional formatting and comparison with the median value in the same pivot table
Hi everyone,
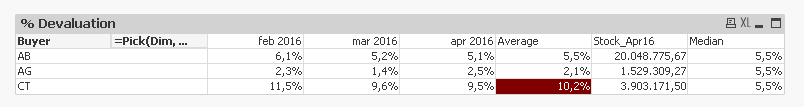
what I would like to do is to display in the same table the example you see in my excel attached in sheet "TO Display", you can see also the formulas.
I tried to do that in qvw but as you can see in my attached qvw, I'm stopped at the calculation of the % per Buyer/MonthYear.
Do you think that is possible to implement my excel example exactly in the same pivot table qvw?
Maybe I have to separate some of those information, average or median, in some other table?
Thanks for your help.
Filiberto
- « Previous Replies
-
- 1
- 2
- Next Replies »
- Mark as New
- Bookmark
- Subscribe
- Mute
- Subscribe to RSS Feed
- Permalink
- Report Inappropriate Content
- Mark as New
- Bookmark
- Subscribe
- Mute
- Subscribe to RSS Feed
- Permalink
- Report Inappropriate Content
I think my solution may be suffering from the same issue. It might still be picking the Median from the original data rather than the median from the three averages. I am not 100% sure though. Lets see what Stefan mentions.
- Mark as New
- Bookmark
- Subscribe
- Mute
- Subscribe to RSS Feed
- Permalink
- Report Inappropriate Content
Anyway I think that median value in the solution of stalwar1 should be 5,4% and not 5,2%. Don't you think so?
I think that's correct (if you refer to the median of the average column).
- Mark as New
- Bookmark
- Subscribe
- Mute
- Subscribe to RSS Feed
- Permalink
- Report Inappropriate Content
- Mark as New
- Bookmark
- Subscribe
- Mute
- Subscribe to RSS Feed
- Permalink
- Report Inappropriate Content
May be like this in the background color for the expression:
=If(Dim = 2 and Avg(Aggr(NODISTINCT Sum(Devaluation)/Sum(Stock),Buyer,MonthYear)) = Max(TOTAL Aggr(NODISTINCT Avg(Aggr(NODISTINCT Sum(Devaluation)/Sum(Stock),Buyer,MonthYear)), Buyer)), Red())
- Mark as New
- Bookmark
- Subscribe
- Mute
- Subscribe to RSS Feed
- Permalink
- Report Inappropriate Content
Use a background color attribute expression like
=If(Dim = 2 and
Avg(Aggr(NODISTINCT Sum(Devaluation)/Sum(Stock),Buyer,MonthYear)) >
Median(TOTAL Aggr( Avg(Aggr(Sum(Devaluation)/Sum(Stock), Buyer, MonthYear)),Buyer))
, lightred()
)
edit: removed the unneeded number formatting
- « Previous Replies
-
- 1
- 2
- Next Replies »