Unlock a world of possibilities! Login now and discover the exclusive benefits awaiting you.
- Qlik Community
- :
- All Forums
- :
- QlikView App Dev
- :
- Re: Conditionally showing or hiding a line in a li...
- Subscribe to RSS Feed
- Mark Topic as New
- Mark Topic as Read
- Float this Topic for Current User
- Bookmark
- Subscribe
- Mute
- Printer Friendly Page
- Mark as New
- Bookmark
- Subscribe
- Mute
- Subscribe to RSS Feed
- Permalink
- Report Inappropriate Content
Conditionally showing or hiding a line in a line chart
Hi ,
I am new to QlikView and I would like to a get some help on an issue.Here is the sample data I have:
Plant,Supplier,SupplyQuantity,DemandQuantity,Week
P1,S1,10,10,W1
P1,S2,20,25,W1
P1,S1,25,30,W2
P1,S2,0,10,W2
Now I want to create a line graph,with the dimension is a cyclic group having fields "Supplier" and "Week" and the expressions are "sum(SupplyQuantity)" and "sum(DemandQuantity)".
The DemandQuantity line should show always.
My Customer put a condition on showing the Supply Quantity Line:where the line should show only if ALL THE SUPPLIERS IN THE SELECTD GROUP IS HAVING A VALUE GREATER THAN 0.
For eg:If I will not do any selection ,the Supply Quantity Line should not show,because we have 0 Supply Qunatity for the Supplier S2 for the week W2.
if I select the 'Week' W1,the Supply Quantity Line should show,because both SUPPLIERS having a value greater than 0.
If I select the 'Week' W2, ,the Supply Quantity Line should not show,because we have 0 Supply Qunatity for the Supplier S2 for the week W2.
Not sure we can do it by Set Analysis.
Could somebody help on this please?
Thanks,
Anderson
- Mark as New
- Bookmark
- Subscribe
- Mute
- Subscribe to RSS Feed
- Permalink
- Report Inappropriate Content
if i understand your Problem correctly ...you can do something like this...
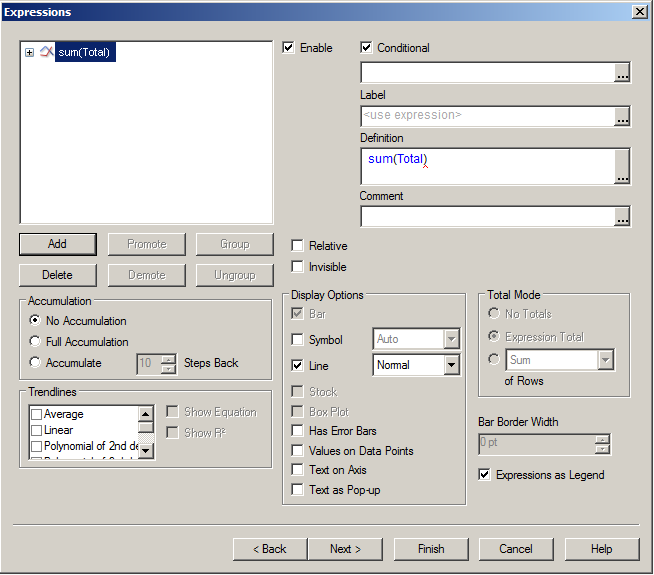
select the checkbox "Conditional" and in the below dilogue box you can write the condition.
hope it helps.
Thanks & Regards,
Venkat T
- Mark as New
- Bookmark
- Subscribe
- Mute
- Subscribe to RSS Feed
- Permalink
- Report Inappropriate Content
Hi Venkat,
Thanks for the reply.
My customer is using QV 10 and I think 'Conditional' option available only in QV 11.I am trying to put an expression in the background color attribute of the line so that I can put no color if i dont want to show the line,I do not know how to write that expression.
Could you help me on this?
Thanks Again.
- Mark as New
- Bookmark
- Subscribe
- Mute
- Subscribe to RSS Feed
- Permalink
- Report Inappropriate Content
Could sombody put some light on this please.
Thanks in advance.
- Mark as New
- Bookmark
- Subscribe
- Mute
- Subscribe to RSS Feed
- Permalink
- Report Inappropriate Content
In QV 10 'Conditional' option is available for entire charts (Layout->Show->Conditional).
Create two charts and type Show Condition expressions so that to show the user the right one.