Unlock a world of possibilities! Login now and discover the exclusive benefits awaiting you.
- Qlik Community
- :
- All Forums
- :
- QlikView App Dev
- :
- Continuety of Running Avearge
- Subscribe to RSS Feed
- Mark Topic as New
- Mark Topic as Read
- Float this Topic for Current User
- Bookmark
- Subscribe
- Mute
- Printer Friendly Page
- Mark as New
- Bookmark
- Subscribe
- Mute
- Subscribe to RSS Feed
- Permalink
- Report Inappropriate Content
Continuety of Running Avearge
Hi,
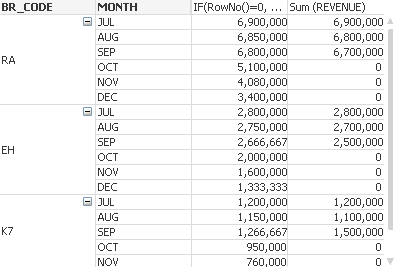
Please refer my chart where only three months actual were stated with balance months zero values. But Running average calculated continue with different values.Of course for Ra eg, it should be 6.8 millions even for rest of the Months.Please see why this is so!
Expression used as follows!
IF(RowNo()=0, Sum(REVENUE)/COUNT(REVENUE),RangeAvg(Above(RangeSum(REVENUE),0,RowNo())))
Thanks
Neville
- « Previous Replies
-
- 1
- 2
- Next Replies »
- Mark as New
- Bookmark
- Subscribe
- Mute
- Subscribe to RSS Feed
- Permalink
- Report Inappropriate Content
Thanks Dear Anil,
Please see now!
Neville
- Mark as New
- Bookmark
- Subscribe
- Mute
- Subscribe to RSS Feed
- Permalink
- Report Inappropriate Content
Hi,
try this
IF(RowNo()=0, Sum(REVENUE)/COUNT(REVENUE),RangeAvg(Above(Sum(REVENUE)/Count({<MONTH={"=Sum(REVENUE) <> 0"}>} DISTINCT MONTH),0,RowNo())))
- Mark as New
- Bookmark
- Subscribe
- Mute
- Subscribe to RSS Feed
- Permalink
- Report Inappropriate Content
Dear Antonio,
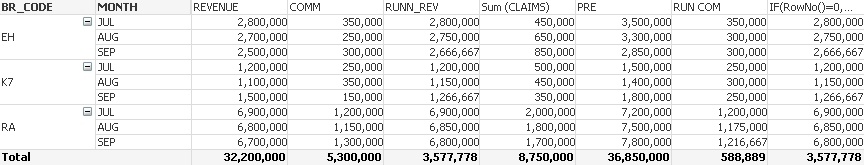
Your expression did work which is in the 1st sheet data. I have a 2nd sheet which extract latest Month running total from the 1st table data. when the same formula applied the figures produce are wrong. In this sheet I do not show all the Months but only latest Month data.
Thanks
Neville

- Mark as New
- Bookmark
- Subscribe
- Mute
- Subscribe to RSS Feed
- Permalink
- Report Inappropriate Content
Try
Avg(Aggr(Sum(REVENUE),BR_CODE,MONTH))
- Mark as New
- Bookmark
- Subscribe
- Mute
- Subscribe to RSS Feed
- Permalink
- Report Inappropriate Content
Dear Antonio,
Your expression is alright. It worked. Could you please suggest me an expression to get the running total to the 2nd sheet from the 1st table. Here again it should be the total of each Branch separately.In other words the cumulative total of each Branch as at Sept.
Regds
Nville
- Mark as New
- Bookmark
- Subscribe
- Mute
- Subscribe to RSS Feed
- Permalink
- Report Inappropriate Content
What is Your expected result ?
- Mark as New
- Bookmark
- Subscribe
- Mute
- Subscribe to RSS Feed
- Permalink
- Report Inappropriate Content
For RA it should be 680000, for EH 2666667 & for K7 1266667 etc
Like running average , above figures to be brought to the 2nd sheet.
Thanks
Neville
- Mark as New
- Bookmark
- Subscribe
- Mute
- Subscribe to RSS Feed
- Permalink
- Report Inappropriate Content
Avg(Aggr(Sum(REVENUE),BR_CODE,MONTH))

- « Previous Replies
-
- 1
- 2
- Next Replies »