Unlock a world of possibilities! Login now and discover the exclusive benefits awaiting you.
- Qlik Community
- :
- All Forums
- :
- QlikView App Dev
- :
- Control chart with list box
- Subscribe to RSS Feed
- Mark Topic as New
- Mark Topic as Read
- Float this Topic for Current User
- Bookmark
- Subscribe
- Mute
- Printer Friendly Page
- Mark as New
- Bookmark
- Subscribe
- Mute
- Subscribe to RSS Feed
- Permalink
- Report Inappropriate Content
Control chart with list box
Hi ,
i have 3 charts, as you can see from picture.
The first is the complete set of data, and the other two is its sub range looking to countries.
I have created 3 list box to remove data from chart, but i would be that each list box influence a specific chart and not all.
So "measurement global" should influence only "global control" chart, measurement jaingyin should influence only "jaingyin control" chart", and measurement alonte should influence only "alonte control" chart".
Please , How i can solve with this ?
- Mark as New
- Bookmark
- Subscribe
- Mute
- Subscribe to RSS Feed
- Permalink
- Report Inappropriate Content
Hi Farfalla,
I think that you can use set analysis. If you attach your expressions, I would help you.
Regards
Miguel del Valle
- Mark as New
- Bookmark
- Subscribe
- Mute
- Subscribe to RSS Feed
- Permalink
- Report Inappropriate Content
Hi Miguel,
the series is very simple I am just presenting length measurement, so x there are the value of these measurements and in y the measurement moment.
Please see the attachment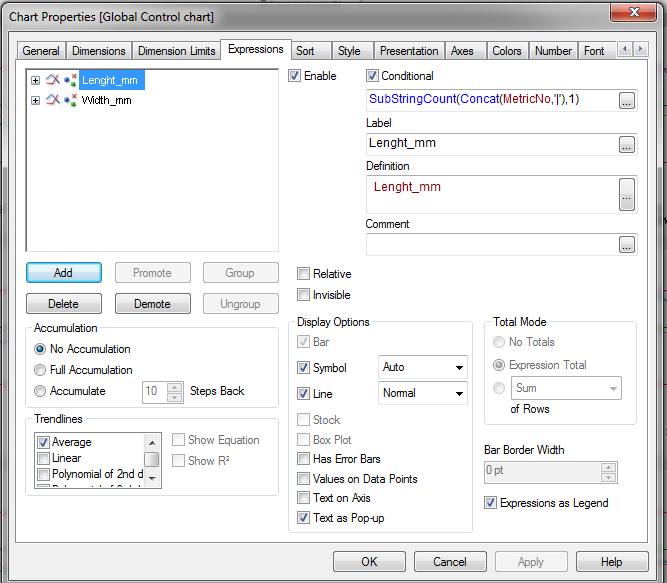
- Mark as New
- Bookmark
- Subscribe
- Mute
- Subscribe to RSS Feed
- Permalink
- Report Inappropriate Content
Hi Farfalla,
You can try this:
sum({1}Lenght_mn)
If not it´s ok ,tell me and I will look for others solutions.
Regards
Miguel del Valle
- Mark as New
- Bookmark
- Subscribe
- Mute
- Subscribe to RSS Feed
- Permalink
- Report Inappropriate Content
This sounds like an alternate states problem. I would create 3 states, one for each of your chart. Then create 3 list boxes for the field, one in each state. Then use set analysis to select the relevant state for each chart. You can search here for "alternate state".
If you want more specific help, I suggest that you post a sample qvw file, as the images do not provide all the information needed, such as the field in the list boxes, the chart dimensions and more specifics about your data model.
Preparing examples for Upload - Reduction and Data Scrambling