Unlock a world of possibilities! Login now and discover the exclusive benefits awaiting you.
- Qlik Community
- :
- All Forums
- :
- QlikView App Dev
- :
- Re: Convert result of an expression into a constan...
- Subscribe to RSS Feed
- Mark Topic as New
- Mark Topic as Read
- Float this Topic for Current User
- Bookmark
- Subscribe
- Mute
- Printer Friendly Page
- Mark as New
- Bookmark
- Subscribe
- Mute
- Subscribe to RSS Feed
- Permalink
- Report Inappropriate Content
Convert result of an expression into a constant for use in second expression
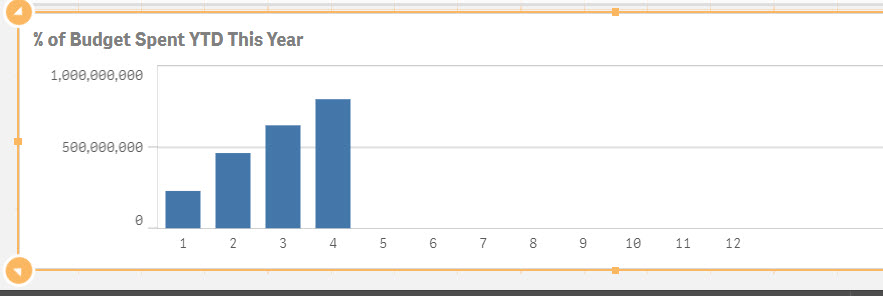
I'm trying to create a chart that shows the YTD expenses as a % of the total year's budget. My data is such that for each month, I have that month's expenses; my budget is an annual budget which is reloaded each month and can change during the year.
We operate on a July fiscal calendar and are currently reporting for October so I want to show a chart that shows July Actuals as a % of the October Budget, August YTD as % of the October Budget, etc. Next month, I want to use the November Budget as my denominator.
We're using a master calendar that has a PeriodType (Current, FYTD, and PJTD (running total) and an AsOfPeriod so that the user can go back to a point in time for reporting.
All of the set analysis of tried has failed.
I can get the running FYTD Actuals total with
sum({<PeriodType={'YTD'},AsOfPeriod=>}Actuals*[CY Flag])
I can get the current Budget with
Sum({<PeriodType={'Current'},AsOfPeriod={"$(=max(AsOfPeriod))"}>}[Cost Budget]) but only for the current fiscal month (x-axis) that aligns with my AsOfPeriod
I need to be able to evaluate the budget for the current AsOfPeriod (with other filter selections like department) applied, then use that as a constant in the denominator for my YTD % of budget spent calculation.
Any help is appreciated.
Accepted Solutions
- Mark as New
- Bookmark
- Subscribe
- Mute
- Subscribe to RSS Feed
- Permalink
- Report Inappropriate Content
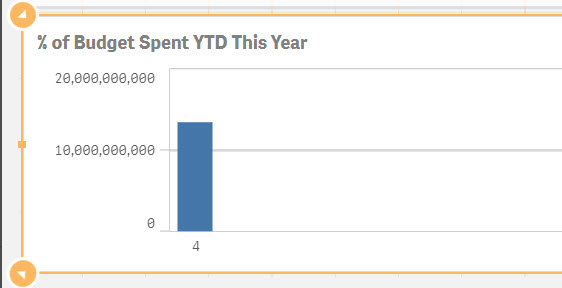
It sounds like you just need to ignore the x-axis. If so, you can do that with "total".
Sum({<PeriodType={'Current'},AsOfPeriod={"$(=max(AsOfPeriod))"}>} total [Cost Budget])
- Mark as New
- Bookmark
- Subscribe
- Mute
- Subscribe to RSS Feed
- Permalink
- Report Inappropriate Content
It sounds like you just need to ignore the x-axis. If so, you can do that with "total".
Sum({<PeriodType={'Current'},AsOfPeriod={"$(=max(AsOfPeriod))"}>} total [Cost Budget])
- Mark as New
- Bookmark
- Subscribe
- Mute
- Subscribe to RSS Feed
- Permalink
- Report Inappropriate Content
I think from what I understand, it seems that johnw is right. You just need to see the same value (4) across all the months and TOTAL qualifier should be able to help you do that for your denominator. Read more about total qualifier here: What does the TOTAL qualifier do?
- Mark as New
- Bookmark
- Subscribe
- Mute
- Subscribe to RSS Feed
- Permalink
- Report Inappropriate Content
Thank you both - that did it.