Unlock a world of possibilities! Login now and discover the exclusive benefits awaiting you.
Announcements
FLASH SALE: Save $500! Use code FLASH2026 at checkout until Feb 14th at 11:59PM ET. Register Now!
- Qlik Community
- :
- All Forums
- :
- QlikView App Dev
- :
- Re: Corrupted Chart Axis
Options
- Subscribe to RSS Feed
- Mark Topic as New
- Mark Topic as Read
- Float this Topic for Current User
- Bookmark
- Subscribe
- Mute
- Printer Friendly Page
Turn on suggestions
Auto-suggest helps you quickly narrow down your search results by suggesting possible matches as you type.
Showing results for
Not applicable
2015-11-13
03:11 PM
- Mark as New
- Bookmark
- Subscribe
- Mute
- Subscribe to RSS Feed
- Permalink
- Report Inappropriate Content
Corrupted Chart Axis
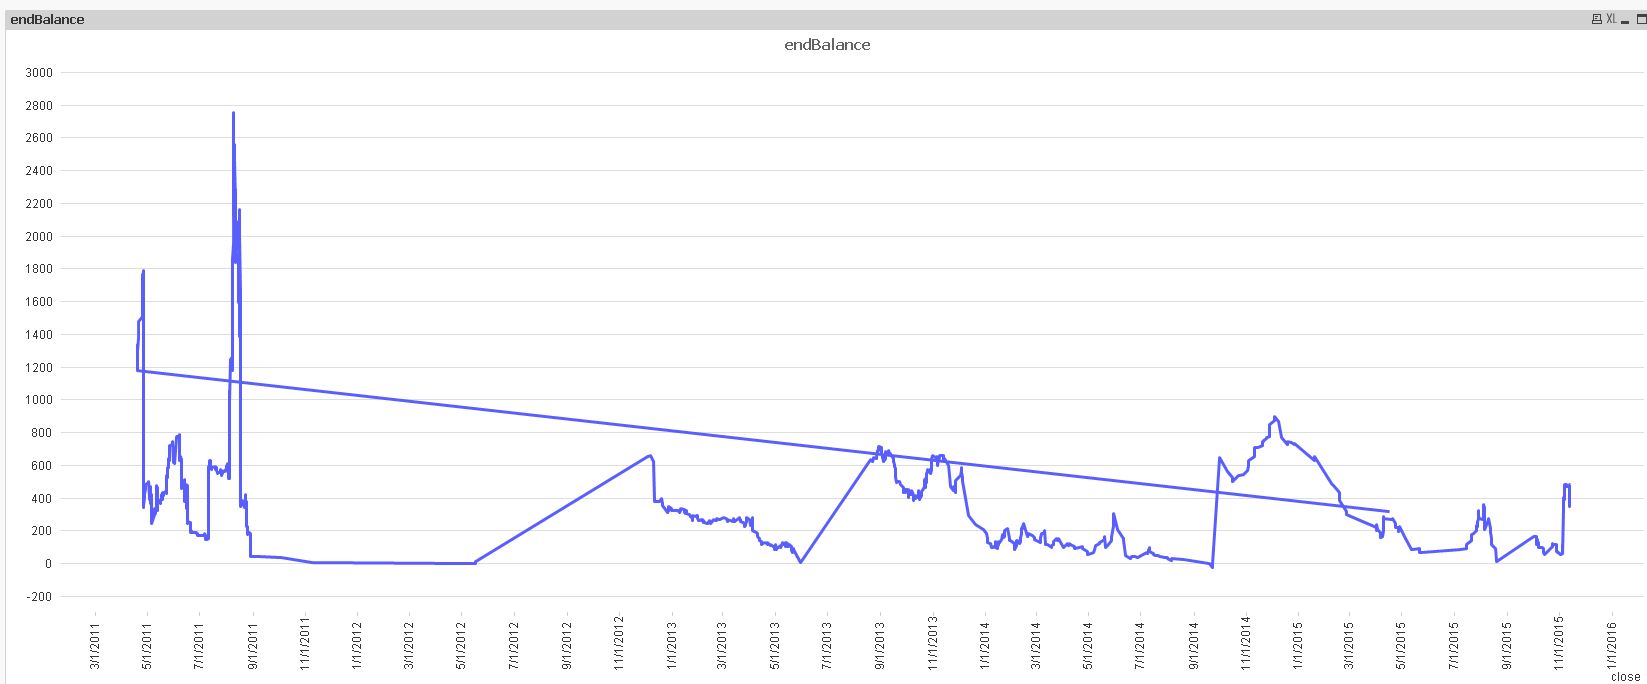
I have a fairly large data set that I wish to show complete without having to scroll.
I've enabled continuous on the dimension axis, but it seems like when the number of data points reaches a certain value, the chart becomes corrupted.
- Tags:
- new_to_qlikview
600 Views
1 Solution
Accepted Solutions
MVP
2015-11-15
05:25 PM
- Mark as New
- Bookmark
- Subscribe
- Mute
- Subscribe to RSS Feed
- Permalink
- Report Inappropriate Content
please post sample application to check your sorting settings.
regards
Marco
3 Replies
Not applicable
2015-11-13
03:13 PM
Author
- Mark as New
- Bookmark
- Subscribe
- Mute
- Subscribe to RSS Feed
- Permalink
- Report Inappropriate Content
Posting chart image again as it did not appear to work in original post
495 Views
MVP
2015-11-15
05:25 PM
- Mark as New
- Bookmark
- Subscribe
- Mute
- Subscribe to RSS Feed
- Permalink
- Report Inappropriate Content
please post sample application to check your sorting settings.
regards
Marco
Not applicable
2015-11-16
07:12 AM
Author
- Mark as New
- Bookmark
- Subscribe
- Mute
- Subscribe to RSS Feed
- Permalink
- Report Inappropriate Content
Your comment alone answered my question. I have updated sorting settings, and the data now looks correct.