Unlock a world of possibilities! Login now and discover the exclusive benefits awaiting you.
- Qlik Community
- :
- All Forums
- :
- QlikView App Dev
- :
- Count a field with mixed values in a column
- Subscribe to RSS Feed
- Mark Topic as New
- Mark Topic as Read
- Float this Topic for Current User
- Bookmark
- Subscribe
- Mute
- Printer Friendly Page
- Mark as New
- Bookmark
- Subscribe
- Mute
- Subscribe to RSS Feed
- Permalink
- Report Inappropriate Content
Count a field with mixed values in a column
Hi Qlikview Experts,
What is the correct syntax in expression to count the mixed values in a field? The number in each cell could be any values ranged from 1 to 99 with a 'comma' in between if there are more than 2 values. I have a set of raw data pasted in below:
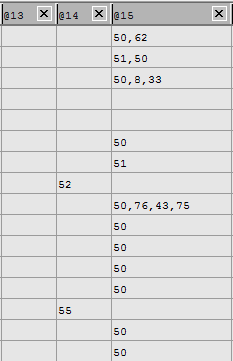
So I want to create a chart and use expression to display the numbers appeared in '@14' and '@15' columns and the number of times it has appeared. For example, number 50 (11 times), number 51 (2 times) and etc. Any ideas would be greatly appreciated!  I had attached my raw data file and qvw for the ease of your reference.
Best Regards
- « Previous Replies
-
- 1
- 2
- Next Replies »
Accepted Solutions
- Mark as New
- Bookmark
- Subscribe
- Mute
- Subscribe to RSS Feed
- Permalink
- Report Inappropriate Content
PFA
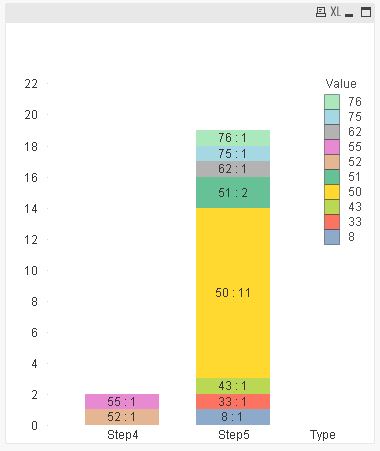
Update: since you have a personal edition
Script:
CrossTable LOAD @1 as MachineNumber,
SubField(@12,',') as Step2,
SubField(@13,',') as Step3,
SubField(@14,',') as Step4,
SubField(@15,',') as Step5
From <>;
Chart (stacked bar):
Dim1: Type
Dim2: Value
Exp:
Dual(Value &' : '& Count({<Value={"=len(trim(Value))>0"}>}Value),
Count({<Value={"=len(trim(Value))>0"}>}Value)
)
- Mark as New
- Bookmark
- Subscribe
- Mute
- Subscribe to RSS Feed
- Permalink
- Report Inappropriate Content
How would your expected output look like here?
- Mark as New
- Bookmark
- Subscribe
- Mute
- Subscribe to RSS Feed
- Permalink
- Report Inappropriate Content
Dear Tresesco B,
I hope the output could be display in bar chart or any other charts that can have similar visualization effect. Different number will be represent by a different color.
- Mark as New
- Bookmark
- Subscribe
- Mute
- Subscribe to RSS Feed
- Permalink
- Report Inappropriate Content
Could you draw an outline - what would be the dimension and ...?
- Mark as New
- Bookmark
- Subscribe
- Mute
- Subscribe to RSS Feed
- Permalink
- Report Inappropriate Content
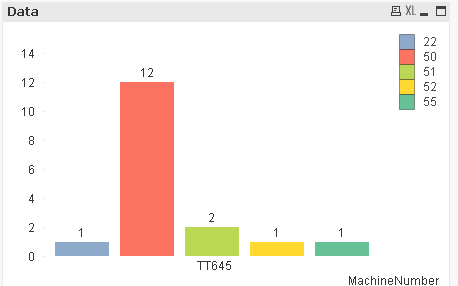
I try this manner
is it ok ?
- Mark as New
- Bookmark
- Subscribe
- Mute
- Subscribe to RSS Feed
- Permalink
- Report Inappropriate Content
Dear Tresesco B,
I would name @12, @13, @14 and @15 as Step1, Step2, Step3 & Step4 respectively. So I would like to have my dimension to be Step1, Step2, Step3 and Step4. Then inside the bar chart it will show the different type of numbers with the number of times beside it. Something look similar like this
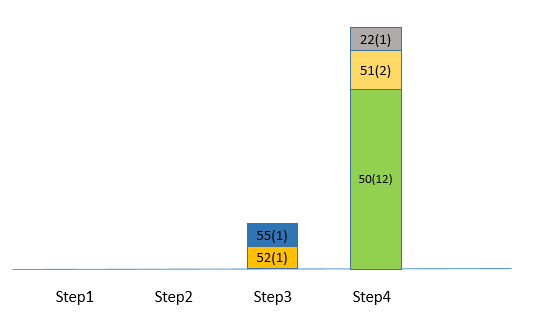
Best Regards
- Mark as New
- Bookmark
- Subscribe
- Mute
- Subscribe to RSS Feed
- Permalink
- Report Inappropriate Content
Dear Vishal,
Due to personal edition, I was unable to open the qvw file sent by you. Could you show me a screenshot on the outcome? Thanks for your help in advance!
Best Regards
- Mark as New
- Bookmark
- Subscribe
- Mute
- Subscribe to RSS Feed
- Permalink
- Report Inappropriate Content
Could you maybe create a new table with all the separate values in one field? Like this:
ValueCount:
LOAD SubField(@13,',') as Value
Resident SourceData;
Concatenate(test_count) LOAD
SubField(@14,',') as Value
Resident SourceData;
Concatenate(test_count) LOAD
SubField(@15,',') as Value
Resident SourceData;
Then you could just create a chart with "Value" as dimension and count(Value) as measure.
- Mark as New
- Bookmark
- Subscribe
- Mute
- Subscribe to RSS Feed
- Permalink
- Report Inappropriate Content
PFA
Update: since you have a personal edition
Script:
CrossTable LOAD @1 as MachineNumber,
SubField(@12,',') as Step2,
SubField(@13,',') as Step3,
SubField(@14,',') as Step4,
SubField(@15,',') as Step5
From <>;
Chart (stacked bar):
Dim1: Type
Dim2: Value
Exp:
Dual(Value &' : '& Count({<Value={"=len(trim(Value))>0"}>}Value),
Count({<Value={"=len(trim(Value))>0"}>}Value)
)
- Mark as New
- Bookmark
- Subscribe
- Mute
- Subscribe to RSS Feed
- Permalink
- Report Inappropriate Content
- « Previous Replies
-
- 1
- 2
- Next Replies »