Unlock a world of possibilities! Login now and discover the exclusive benefits awaiting you.
- Qlik Community
- :
- All Forums
- :
- QlikView App Dev
- :
- Count with a condition
- Subscribe to RSS Feed
- Mark Topic as New
- Mark Topic as Read
- Float this Topic for Current User
- Bookmark
- Subscribe
- Mute
- Printer Friendly Page
- Mark as New
- Bookmark
- Subscribe
- Mute
- Subscribe to RSS Feed
- Permalink
- Report Inappropriate Content
Count with a condition
Hi folks
I have a doubt in displaying the count from an excel sheet
I have an excel sheet with 3 fields
| Date | Name | Status |
| 22-Aug-12 | DBA | AU |
| 22-Aug-12 | DBA | CU |
| 22-Aug-12 | DPR | AU |
| 22-Aug-12 | DPR | BU |
| 22-Aug-12 | DPR | DU |
| 22-Aug-12 | ABC | AU |
| 22-Aug-12 | ABC | CU |
| 22-Aug-12 | MNB | DU |
| 22-Aug-12 | MNB | AU |
| 22-Aug-12 | MNB | CU |
| 22-Aug-12 | MNB | DU |
| 22-Aug-12 | MNB | BU |
| 22-Aug-12 | MNB | DU |
if i set a expression to count the number of entries for a Name DBA it is showing the count as 2 and its correct
But i need to find the count of entries based on status also for
eg : for DBA and AU the count is 1
and for MNB and DU count is 3
Regards
- « Previous Replies
-
- 1
- 2
- Next Replies »
- Mark as New
- Bookmark
- Subscribe
- Mute
- Subscribe to RSS Feed
- Permalink
- Report Inappropriate Content
see attached, but i´m not sure if this is what you want.
- Mark as New
- Bookmark
- Subscribe
- Mute
- Subscribe to RSS Feed
- Permalink
- Report Inappropriate Content
Sorry Michael
Currently am working from a Personal Edition QlikView 
if possible please paste the expression here.
Regards
- Mark as New
- Bookmark
- Subscribe
- Mute
- Subscribe to RSS Feed
- Permalink
- Report Inappropriate Content
Can you please tell the output format you want?
- Mark as New
- Bookmark
- Subscribe
- Mute
- Subscribe to RSS Feed
- Permalink
- Report Inappropriate Content
- Mark as New
- Bookmark
- Subscribe
- Mute
- Subscribe to RSS Feed
- Permalink
- Report Inappropriate Content
- Mark as New
- Bookmark
- Subscribe
- Mute
- Subscribe to RSS Feed
- Permalink
- Report Inappropriate Content
Hi,
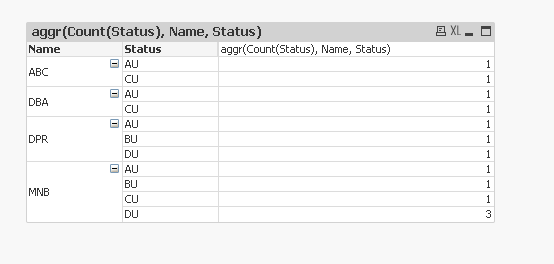
Use a pivot table and use expression as
=aggr(Count(Status), Name, Status)
Please find attached
HTH
Sushil
- Mark as New
- Bookmark
- Subscribe
- Mute
- Subscribe to RSS Feed
- Permalink
- Report Inappropriate Content
What you could do, is in your load script:
LOAD
Date, Name, Status
, Name & ' - ' & Status AS yourField....
Now in your front end, you can do a count on the created field, i.e. Count(yourField) should give you a count of unique joins for Name and Status.
Hope this helps.
- Mark as New
- Bookmark
- Subscribe
- Mute
- Subscribe to RSS Feed
- Permalink
- Report Inappropriate Content
Hello Bakshi,
If the dimension members(Name, Status) are there in the pivot table, aggr() function would not be required, only Count() would be enogh. Isn't it?
- Mark as New
- Bookmark
- Subscribe
- Mute
- Subscribe to RSS Feed
- Permalink
- Report Inappropriate Content
PFA
- « Previous Replies
-
- 1
- 2
- Next Replies »