Unlock a world of possibilities! Login now and discover the exclusive benefits awaiting you.
- Qlik Community
- :
- All Forums
- :
- QlikView App Dev
- :
- Re: Counting Tasks Help
- Subscribe to RSS Feed
- Mark Topic as New
- Mark Topic as Read
- Float this Topic for Current User
- Bookmark
- Subscribe
- Mute
- Printer Friendly Page
- Mark as New
- Bookmark
- Subscribe
- Mute
- Subscribe to RSS Feed
- Permalink
- Report Inappropriate Content
Counting Tasks Help
Hello, I have some data which is a list of people and a list of different tasks they have completed. For example
Name Task
Fred Cleaning
Fred Hoovering
Jane Washing
Fred Cleaning
Jane Cleaning
Fred Hoovering
How can I write an expression or a formula that will count the number of times the people have done different tasks,
For example
Name Cleaning Hoovering Washing
Fred 2 2 0
Jane 1 0 1
Thanks Paul
- Tags:
- new_to_qlikview
Accepted Solutions
- Mark as New
- Bookmark
- Subscribe
- Mute
- Subscribe to RSS Feed
- Permalink
- Report Inappropriate Content
hi
try like this
take dimension as Name and task in pivot
and write the expression like count(task)
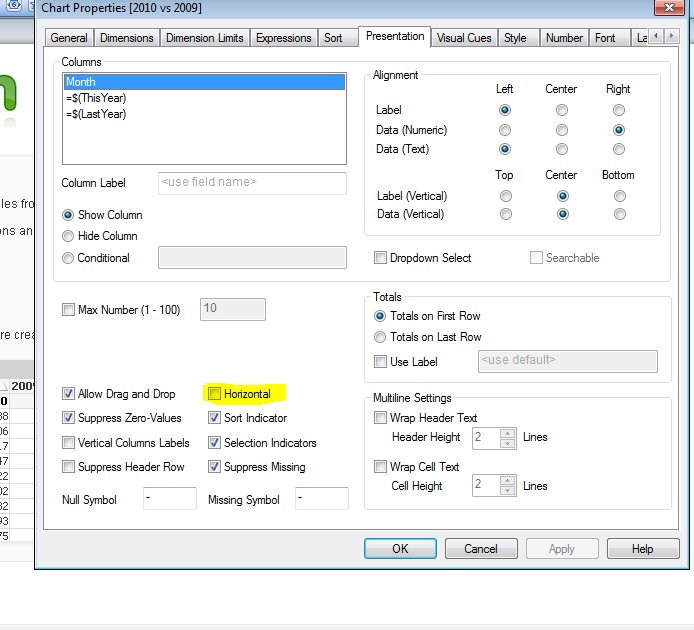
then drag and drop the task as horizontal
or
try like this
take dimension as name
then write the expression like
Cleaning: Count({<Task={"Cleaning"}>}Task)
Hoovering: Count({<Task={"Hoovering"}>}Task)
Washing: Count({<Task={"Washing"}>}Task)
Hope this will helps you
Thanks & Regards
Nirmal
- Mark as New
- Bookmark
- Subscribe
- Mute
- Subscribe to RSS Feed
- Permalink
- Report Inappropriate Content
Load your data then add a chart (straight table) then
add Name and task as dimension
add the following expression: Count(Task)
let me know
- Mark as New
- Bookmark
- Subscribe
- Mute
- Subscribe to RSS Feed
- Permalink
- Report Inappropriate Content
hi
try like this
take dimension as Name and task in pivot
and write the expression like count(task)
then drag and drop the task as horizontal
or
try like this
take dimension as name
then write the expression like
Cleaning: Count({<Task={"Cleaning"}>}Task)
Hoovering: Count({<Task={"Hoovering"}>}Task)
Washing: Count({<Task={"Washing"}>}Task)
Hope this will helps you
Thanks & Regards
Nirmal
- Mark as New
- Bookmark
- Subscribe
- Mute
- Subscribe to RSS Feed
- Permalink
- Report Inappropriate Content
HEy ,
I am trying to drop column task as horizontal but cann't do it. Can you please tell me how to make taks column horizontall ??
Thanks
- Mark as New
- Bookmark
- Subscribe
- Mute
- Subscribe to RSS Feed
- Permalink
- Report Inappropriate Content
are you using pivot table or straight table?
- Mark as New
- Bookmark
- Subscribe
- Mute
- Subscribe to RSS Feed
- Permalink
- Report Inappropriate Content
I am using Straight Table
- Mark as New
- Bookmark
- Subscribe
- Mute
- Subscribe to RSS Feed
- Permalink
- Report Inappropriate Content
