Unlock a world of possibilities! Login now and discover the exclusive benefits awaiting you.
- Qlik Community
- :
- All Forums
- :
- QlikView App Dev
- :
- Counting events on a growing population - help
- Subscribe to RSS Feed
- Mark Topic as New
- Mark Topic as Read
- Float this Topic for Current User
- Bookmark
- Subscribe
- Mute
- Printer Friendly Page
- Mark as New
- Bookmark
- Subscribe
- Mute
- Subscribe to RSS Feed
- Permalink
- Report Inappropriate Content
Counting events on a growing population - help
Hello Qlikcommunity,
I am requesting your help for a problem I can' t solve myself.
I have 2 sets of data
One containing vehicle information, dimensions are : vehicle_id assembly_date country (+ other descriptive variables)
One containing events information, dimensions are : vehicle_id event_date (+ other descriptive variables)
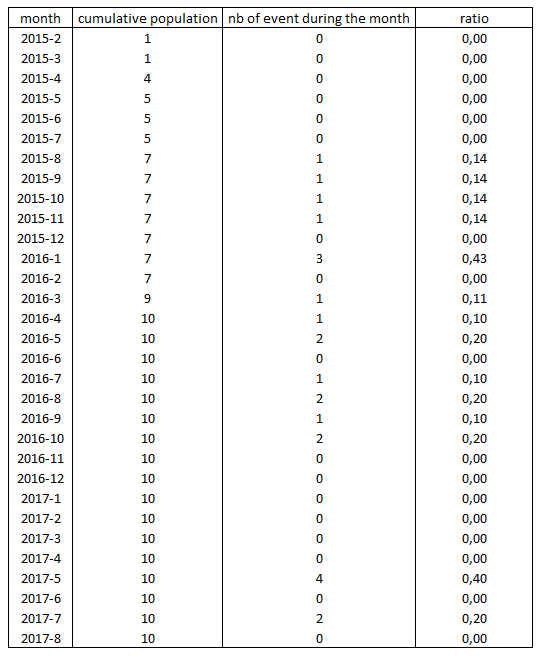
I would like to calculate per month the ratio : [number of events during the month] / [cumulative population so far]
I have no problem displaying these 2 calculations separately but when I try to create the ratio, I am facing 2 problems :
- How to deal with the dimension, how to create a dimension showing months from first assembly date to today ?
- How to simulate the cumulative population in qlikview.
The idea is to transform our data (see file enclosed) into something like this and display ratio per month
Would you have suggestions to achieve this ?
I've enclosed a data sample.
Thank you
- Mark as New
- Bookmark
- Subscribe
- Mute
- Subscribe to RSS Feed
- Permalink
- Report Inappropriate Content
Script
Table:
LOAD vehicle_id,
assembly_date,
country,
Date(MonthStart(assembly_date, IterNo() - 1), 'YYYY-M') as Month
FROM
(ooxml, embedded labels, table is population)
While MonthStart(assembly_date, IterNo() - 1) <= MonthStart(Today());
Events:
LOAD vehicle_id,
event_date,
Date(MonthStart(event_date), 'YYYY-M') as Month
FROM
(ooxml, embedded labels, table is events);
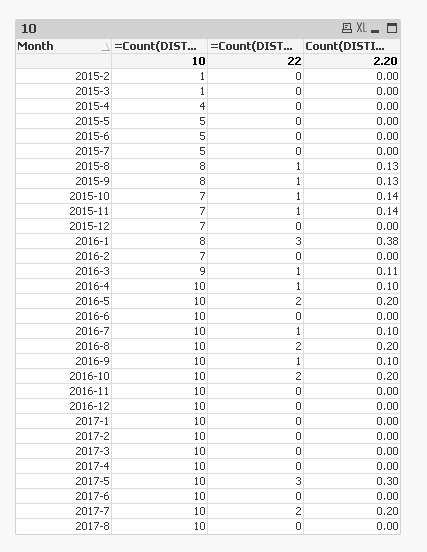
Straight table
Dimension
Month
Expressions
=Count(DISTINCT vehicle_id)
=Count(DISTINCT event_date)
=Count(DISTINCT event_date)/Count(DISTINCT vehicle_id)
- Mark as New
- Bookmark
- Subscribe
- Mute
- Subscribe to RSS Feed
- Permalink
- Report Inappropriate Content
Hello and thank you, the solution seems to work perfectly.
As i understood you have duplicated the vehicle_id and store them in YYYY-M
Is there a risk doing that with huge population (> 1 million) ?
Thank you
- Mark as New
- Bookmark
- Subscribe
- Mute
- Subscribe to RSS Feed
- Permalink
- Report Inappropriate Content
QlikView stores each distinct value once, so storing the same value once per month shouldn't significantly impact performance compared to storing it once.
- Mark as New
- Bookmark
- Subscribe
- Mute
- Subscribe to RSS Feed
- Permalink
- Report Inappropriate Content
Huge application size and it might take extra time to reload... but can't think of other better ways to do this....