Unlock a world of possibilities! Login now and discover the exclusive benefits awaiting you.
- Qlik Community
- :
- All Forums
- :
- QlikView App Dev
- :
- Re: Create Straight Table
- Subscribe to RSS Feed
- Mark Topic as New
- Mark Topic as Read
- Float this Topic for Current User
- Bookmark
- Subscribe
- Mute
- Printer Friendly Page
- Mark as New
- Bookmark
- Subscribe
- Mute
- Subscribe to RSS Feed
- Permalink
- Report Inappropriate Content
Create Straight Table
Hi All,
I have the following data,Based on this data can we prepare Straight table like this
My Data:-
Empid Grade Subject Score
1001 A English 76
1001 A Matha 52
1001 A Science 38
1102 B English 34
1102 B Matha 55
1102 B Science 36
1002 B English 54
1002 B Matha 35
1002 B Science 40
1101 A English 86
1101 A Matha 42
1101 A Science 58
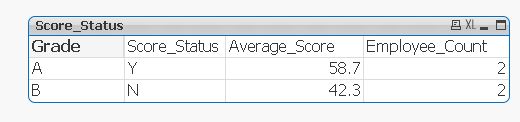
Output:
Grade Score_Status Average_Score Employee_Count
A Y 59.1 2
B N 42.3 2
--I want to Grade,Score_Status are Dimensions and Average_Score,Employee_Count are Expression.
Here Score_Status is if(avg(Score)<=50,'N','Y'))
Regards
Sharath
- « Previous Replies
-
- 1
- 2
- Next Replies »
- Mark as New
- Bookmark
- Subscribe
- Mute
- Subscribe to RSS Feed
- Permalink
- Report Inappropriate Content
Yes it is very straight forward actually:

- Mark as New
- Bookmark
- Subscribe
- Mute
- Subscribe to RSS Feed
- Permalink
- Report Inappropriate Content
Hi Petter,
Please send Score_Status script to me
- Mark as New
- Bookmark
- Subscribe
- Mute
- Subscribe to RSS Feed
- Permalink
- Report Inappropriate Content
Please send script for all Coloumns.
- Mark as New
- Bookmark
- Subscribe
- Mute
- Subscribe to RSS Feed
- Permalink
- Report Inappropriate Content
Hi,
Please check this.
Thank you.
- Mark as New
- Bookmark
- Subscribe
- Mute
- Subscribe to RSS Feed
- Permalink
- Report Inappropriate Content
Hi,
i am using Qlikview personal edition. i can't open your QVW. Please tell the process steps..here
- Mark as New
- Bookmark
- Subscribe
- Mute
- Subscribe to RSS Feed
- Permalink
- Report Inappropriate Content
The dimension is simply the field Grade
The expressions are:
Score_Status:
If( Average_Score <= 50,'N','Y')
Average_Score:
Avg(Score)
Employee_Count:
Count(DISTINCT Empid)
- Mark as New
- Bookmark
- Subscribe
- Mute
- Subscribe to RSS Feed
- Permalink
- Report Inappropriate Content
The load script is:
Data:
LOAD * INLINE [
Empid|Grade|Subject|Score
1001|A|English|76
1001|A|Matha|52
1001|A|Science|38
1102|B|English|34
1102|B|Matha|55
1102|B|Science|36
1002|B|English|54
1002|B|Matha|35
1002|B|Science|40
1101|A|English|86
1101|A|Matha|42
1101|A|Science|58
] (delimiter is |);
- Mark as New
- Bookmark
- Subscribe
- Mute
- Subscribe to RSS Feed
- Permalink
- Report Inappropriate Content
Hi Sharath,
Please try:
script:
MyData:
LOAD * Inline
[
Empid,Grade,Subject,Score
1001,A,English,76
1001,A,Matha,52
1001,A,Science,38
1102,B,English,34
1102,B,Matha,55
1102,B,Science,36
1002,B,English,54
1002,B,Matha,35
1002,B,Science,40
1101,A,English,86
1101,A,Matha,42
1101,A,Science,58
];
left join(MyData)
LOAD Empid,Grade, if(avg(Score)<=50,'N','Y') as Score_Status
Resident MyData
Group by Empid, Grade;
UI:
Straight table
Dimensions - Grade ,Score_Status
Expressions - avg(Score) ,count( DISTINCT Empid)
uncheck suppress zero values in presentation tab
Regards
Neetha
- Mark as New
- Bookmark
- Subscribe
- Mute
- Subscribe to RSS Feed
- Permalink
- Report Inappropriate Content
I need Score_status as dimension and not expression
- « Previous Replies
-
- 1
- 2
- Next Replies »