Unlock a world of possibilities! Login now and discover the exclusive benefits awaiting you.
- Qlik Community
- :
- All Forums
- :
- QlikView App Dev
- :
- Create a dimension in load script
- Subscribe to RSS Feed
- Mark Topic as New
- Mark Topic as Read
- Float this Topic for Current User
- Bookmark
- Subscribe
- Mute
- Printer Friendly Page
- Mark as New
- Bookmark
- Subscribe
- Mute
- Subscribe to RSS Feed
- Permalink
- Report Inappropriate Content
Create a dimension in load script
Hi everyone,
maybe is trivial issue but i'm wondering to create calculated dimension in my script.
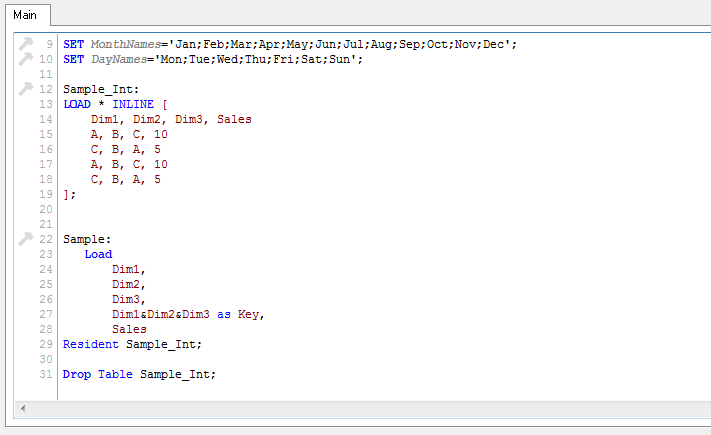
I'm able to create calculated dimension with simple formulas like in my attachment but i don't know how to create dimension a little bit complex.
As you can see here i created the "key" dimension and now i can calculate the value of sales for the dimension...but if i want to create a dimension that is "sales per key" how should i do??

Clear enough?
Thank u all.
sunindia what do u think about it?
Messaggio modificato da Filiberto Cacciari Hi guys, i've attached also my qvw cause i've a new little problem. Now I display the sum of KeySales but I want that when the value of sales is the same it will be sum once. Sample_Int: LOAD * INLINE [ Dim1, Dim2, Dim3, Sales A, B, C, 10 A, B, C, 10 A, B, C, 5 A, B, C, 5 C, B, A, 15 C, B, A, 15 C, B, A, 5 ]; Sum(ABC) = 15 and not 30 Sum(CBA) = 20 and not 35
- « Previous Replies
-
- 1
- 2
- Next Replies »
Accepted Solutions
- Mark as New
- Bookmark
- Subscribe
- Mute
- Subscribe to RSS Feed
- Permalink
- Report Inappropriate Content
Just a minor change. Resident should be from Sample, instead of Sample_Int ![]()
KeySales:
Load
Key,
Sum(Sales) AS KeySales
Resident Sample
Group by Key;
- Mark as New
- Bookmark
- Subscribe
- Mute
- Subscribe to RSS Feed
- Permalink
- Report Inappropriate Content
Hi
KeySales:
Load
Key,
Sum(Sales) AS KeySales
Resident Sample_Int
Group by Key;
Mark
- Mark as New
- Bookmark
- Subscribe
- Mute
- Subscribe to RSS Feed
- Permalink
- Report Inappropriate Content
Just a minor change. Resident should be from Sample, instead of Sample_Int ![]()
KeySales:
Load
Key,
Sum(Sales) AS KeySales
Resident Sample
Group by Key;
- Mark as New
- Bookmark
- Subscribe
- Mute
- Subscribe to RSS Feed
- Permalink
- Report Inappropriate Content
Hi Filiberto,
I wouldn't use the phrase Calculated Dimension for the Key you made in your script because after you load this the field 'Key' will exist in the data model as a dimension, it will not need to be calculated in a chart.
A good tip would be to separate the components of your key with an uncommon character that isn't used in any of the concatenated fields. So instead of the line
Dim1 & Dim2 & Dim3 as Key,
so 'dog' & 'cat' & 'mouse' = 'dogcatmouse' = 'dogc' & 'atm' & 'ouse'
Try
Dim1 & '|' & Dim2 & '|' & Dim3 as Key,
'dog' & '|' & 'cat' & '|' & 'mouse' = 'dog|cat|mouse' <> 'dogc' & '|' & 'atm' & '|' &'ouse'
Hope this is useful.
- Mark as New
- Bookmark
- Subscribe
- Mute
- Subscribe to RSS Feed
- Permalink
- Report Inappropriate Content
Thank you all for your contribute. I've definitely solved my issue. Mark6505 sunindia Effinty2112
- Mark as New
- Bookmark
- Subscribe
- Mute
- Subscribe to RSS Feed
- Permalink
- Report Inappropriate Content
Hi,
If it was helpful can you mark is so
Many Thanks
- Mark as New
- Bookmark
- Subscribe
- Mute
- Subscribe to RSS Feed
- Permalink
- Report Inappropriate Content
Hi Guys,
I've a new issue as you can see.
Sample_Int:
LOAD * INLINE [
Dim1, Dim2, Dim3, Sales
A, B, C, 10
A, B, C, 10
A, B, C, 5
A, B, C, 5
C, B, A, 15
C, B, A, 15
C, B, A, 5
];
Sum(ABC) = 15 and not 30
Sum(CBA) = 20 and not 35
- Mark as New
- Bookmark
- Subscribe
- Mute
- Subscribe to RSS Feed
- Permalink
- Report Inappropriate Content
Hi,
May be use the DISTINCT
Like
Sample_Int:
Load Distinct *,Dim1&Dim2&Dim3 as Key;
LOAD * INLINE [
    Dim1, Dim2, Dim3, Sales
    A, B, C, 10
    A, B, C, 10
    A, B, C, 5
    A, B, C, 5
    C, B, A, 15
    C, B, A, 15
    C, B, A, 5
];
KeySales:
Load Key,
    Sum(Sales) AS KeySales
Resident Sample_Int
Group by Key;
- Mark as New
- Bookmark
- Subscribe
- Mute
- Subscribe to RSS Feed
- Permalink
- Report Inappropriate Content
You want it to show 15 and 20 or 30 and 35?
- Mark as New
- Bookmark
- Subscribe
- Mute
- Subscribe to RSS Feed
- Permalink
- Report Inappropriate Content
15 and 20
- « Previous Replies
-
- 1
- 2
- Next Replies »