Unlock a world of possibilities! Login now and discover the exclusive benefits awaiting you.
- Qlik Community
- :
- All Forums
- :
- QlikView App Dev
- :
- Create a graph that only shows more than one type ...
- Subscribe to RSS Feed
- Mark Topic as New
- Mark Topic as Read
- Float this Topic for Current User
- Bookmark
- Subscribe
- Mute
- Printer Friendly Page
- Mark as New
- Bookmark
- Subscribe
- Mute
- Subscribe to RSS Feed
- Permalink
- Report Inappropriate Content
Create a graph that only shows more than one type of failure per user per day
I am using QlikView to analyze badge failures from a physical access control system log. I am looking to create a graph that only shows more than one type of failure per user per day.
Under type of failures, it can be categorized as Lost, Expired or Disabled. In the log, under the field Category field, one of these types will be present.
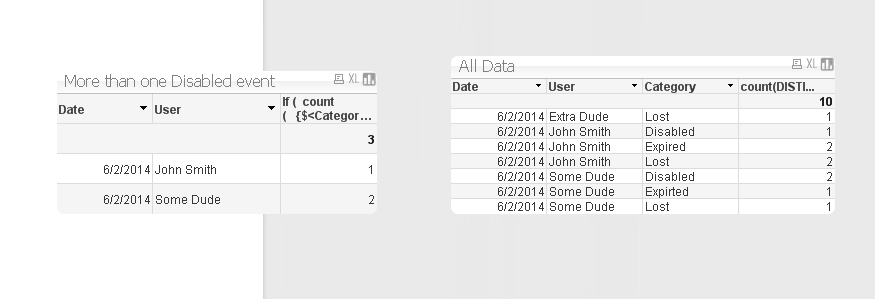
I would like to create a graph that only shows more than 1 “Disabled” event per user per day
What would be the script to create this graph? Does anyone have something similar that I could use as an example?
Thanks!!!
- Tags:
- new_to_qlikview
- Mark as New
- Bookmark
- Subscribe
- Mute
- Subscribe to RSS Feed
- Permalink
- Report Inappropriate Content
An IF statement in the chart expression will probably suffice ,
If ( count(distinct total <User,Day> [Category] ) > 0 , count(distinct total <User,Day> [Category] ) )
By not defining an 'else' condition the value for the user and day will be automatically null() which by default won't show in the chart
Assumes that you have a field called user and day in the chart as well.
- Mark as New
- Bookmark
- Subscribe
- Mute
- Subscribe to RSS Feed
- Permalink
- Report Inappropriate Content
Where would I select “Disabled” from the Category field?
- Mark as New
- Bookmark
- Subscribe
- Mute
- Subscribe to RSS Feed
- Permalink
- Report Inappropriate Content
my oversight. switch the expression to count 'Events' (if you have that field in your data set). And use a SET MODIFIER to only count events where category=disabled.
If ( count( {$<Category={'Disabled'}>} distinct total <User,Day> [EventId] ) > 0 , count( {$<Category={'Disabled'}>} distinct total <User,Day> [EventId] ) )
If your data fields aren't the same as these, kindly mock up an example in Excel and attach to the post.
- Mark as New
- Bookmark
- Subscribe
- Mute
- Subscribe to RSS Feed
- Permalink
- Report Inappropriate Content
- Mark as New
- Bookmark
- Subscribe
- Mute
- Subscribe to RSS Feed
- Permalink
- Report Inappropriate Content
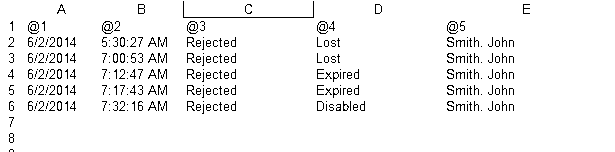
here is a sample. I needed to add an eventID to your data. I used the recno() function because it seems like each row in your data is a new event
LOAD
RecNo() as EventID,
A as Date,
C as Category,
D as User
FROM
(ooxml, no labels, table is Sheet1);
I made your data sample a bit bigger (attached). Also attached is the QVW .