Unlock a world of possibilities! Login now and discover the exclusive benefits awaiting you.
- Qlik Community
- :
- All Forums
- :
- QlikView App Dev
- :
- Re: Create a group in expressions for a line chart
- Subscribe to RSS Feed
- Mark Topic as New
- Mark Topic as Read
- Float this Topic for Current User
- Bookmark
- Subscribe
- Mute
- Printer Friendly Page
- Mark as New
- Bookmark
- Subscribe
- Mute
- Subscribe to RSS Feed
- Permalink
- Report Inappropriate Content
Create a group in expressions for a line chart
Hi,
I have requirement where I need to create a line chart which will show the percentage of Met SLA month & year wise and when I drilldown I should be able to see the Met SLA priority wise (i.e P1,P2...P4) .
Is there a way I can group the Met SLA and Compliance Priority wise?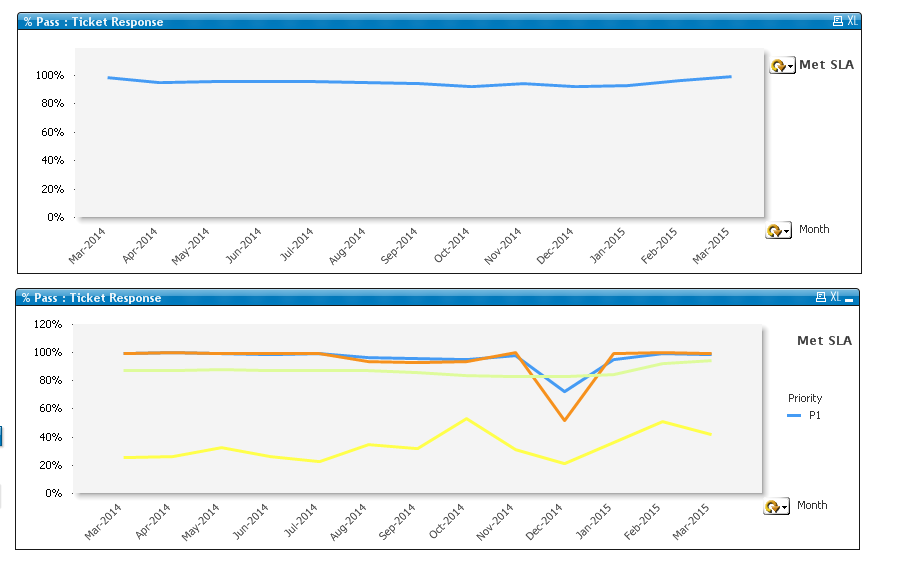
Message was edited by: Mugdha Ojha Added a word document explaining what is my requirement.
- « Previous Replies
-
- 1
- 2
- Next Replies »
Accepted Solutions
- Mark as New
- Bookmark
- Subscribe
- Mute
- Subscribe to RSS Feed
- Permalink
- Report Inappropriate Content
Hi,
Another alternative could be to add an image of the cyclic group and add an action on it to set a variable. Using this variable you can show the Priority. Please see attached.
Regards,
Greeshma
- Mark as New
- Bookmark
- Subscribe
- Mute
- Subscribe to RSS Feed
- Permalink
- Report Inappropriate Content
Could you attached your app?
- Mark as New
- Bookmark
- Subscribe
- Mute
- Subscribe to RSS Feed
- Permalink
- Report Inappropriate Content
Hi Mugdha,
Can you explain a bit more and a sample app will be helpful to understand your requirement more.
Regards
KC
KC
- Mark as New
- Bookmark
- Subscribe
- Mute
- Subscribe to RSS Feed
- Permalink
- Report Inappropriate Content
Hi,
I have added a word document explaining my requirement.
Hope that helps.
- Mark as New
- Bookmark
- Subscribe
- Mute
- Subscribe to RSS Feed
- Permalink
- Report Inappropriate Content
Can someone help me on this?
- Mark as New
- Bookmark
- Subscribe
- Mute
- Subscribe to RSS Feed
- Permalink
- Report Inappropriate Content
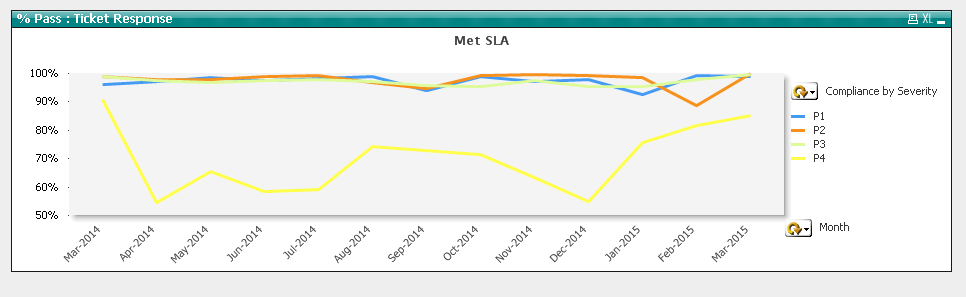
I managed to create the groups.
But I am facing the below issue :
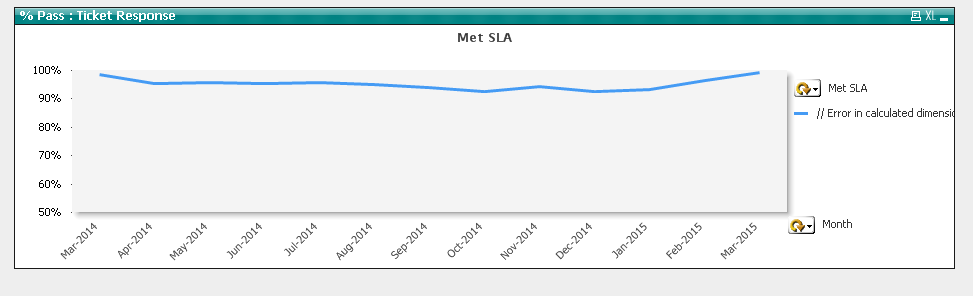
For the Met SLA group I have used expression and I am getting Error in calculated dimension as the legend.
Is there a way I can hide this legend as the line graph is correctly plotted.
- Mark as New
- Bookmark
- Subscribe
- Mute
- Subscribe to RSS Feed
- Permalink
- Report Inappropriate Content
Did you try to give a label to the Expression? Over you can hide the legends from Presentation Tab.
Regards
KC
KC
- Mark as New
- Bookmark
- Subscribe
- Mute
- Subscribe to RSS Feed
- Permalink
- Report Inappropriate Content
I gave a label to the expression and tried hiding legends from Presentation tab but the cyclic group also disappears.
I have attached the app in the main post.
- Mark as New
- Bookmark
- Subscribe
- Mute
- Subscribe to RSS Feed
- Permalink
- Report Inappropriate Content
Hi,
Another alternative could be to add an image of the cyclic group and add an action on it to set a variable. Using this variable you can show the Priority. Please see attached.
Regards,
Greeshma
- Mark as New
- Bookmark
- Subscribe
- Mute
- Subscribe to RSS Feed
- Permalink
- Report Inappropriate Content
Thanks a lot..This is what I wanted!!
- « Previous Replies
-
- 1
- 2
- Next Replies »