Unlock a world of possibilities! Login now and discover the exclusive benefits awaiting you.
- Qlik Community
- :
- All Forums
- :
- QlikView App Dev
- :
- Re: Create dynamic table based on value selected i...
- Subscribe to RSS Feed
- Mark Topic as New
- Mark Topic as Read
- Float this Topic for Current User
- Bookmark
- Subscribe
- Mute
- Printer Friendly Page
- Mark as New
- Bookmark
- Subscribe
- Mute
- Subscribe to RSS Feed
- Permalink
- Report Inappropriate Content
Create dynamic table based on value selected in a listbox
Hello,
I have the the following table loaded (refer code below).
Data:
LOAD * INLINE [
BookedCountry, ManagedCountry, Revenue
France, France, 100
France, Canada, 150
France, Brazil, 80
Germany, Canada, 180
Germany, India, 220
];
I have a listbox for [BookedCountry]. I want to use a script to create a table which will use the table Data as resident table with the where value will be the value I select in the listbox [BookedCountry].
Can you please help me out.
Regards,
Ayandeep
- « Previous Replies
-
- 1
- 2
- Next Replies »
- Mark as New
- Bookmark
- Subscribe
- Mute
- Subscribe to RSS Feed
- Permalink
- Report Inappropriate Content
Hi Ayandeep,
After data load, you can perform the selection operation. You can't generate script throw Selection. In another alternative, you can use resident load to perform any operation.
Thanks,
Arvind Patil
- Mark as New
- Bookmark
- Subscribe
- Mute
- Subscribe to RSS Feed
- Permalink
- Report Inappropriate Content
Your requirement is to show the data which is related to your selection ? if that is the case you could add a table box or straight table and its will filter the records based on your selection
- Mark as New
- Bookmark
- Subscribe
- Mute
- Subscribe to RSS Feed
- Permalink
- Report Inappropriate Content
here you go !!
PFA
- Mark as New
- Bookmark
- Subscribe
- Mute
- Subscribe to RSS Feed
- Permalink
- Report Inappropriate Content
- Mark as New
- Bookmark
- Subscribe
- Mute
- Subscribe to RSS Feed
- Permalink
- Report Inappropriate Content
- Mark as New
- Bookmark
- Subscribe
- Mute
- Subscribe to RSS Feed
- Permalink
- Report Inappropriate Content
Hi Raju,
Can you please provide your solution in the form of screenshots? I have Qlikview personal edition so not able to open your attachment.
Regards,
Ayandeep
- Mark as New
- Bookmark
- Subscribe
- Mute
- Subscribe to RSS Feed
- Permalink
- Report Inappropriate Content
Hi Avinash,
The requirement is to data related to my selection but on a SVGMap so I need the data on a table in the script. Can you please help me out?
Regards,
Ayandeep
- Mark as New
- Bookmark
- Subscribe
- Mute
- Subscribe to RSS Feed
- Permalink
- Report Inappropriate Content
create two list boxes.
one for dimension's
one for Expressions
Like this
Dimensions:
Load * Inline [
Dimensions%
BookedCountry
ManagedCountry
//Note: If you have any dimension's add in Dimensions table
];
Measure:
Load * Inline [
Measure%
Revenue
];
//Note: If you have any Measure's add in Measure table
Take a straight table,
Dimension: BookedCountry and ManagedCountry
Measure: Sum(Revenue)
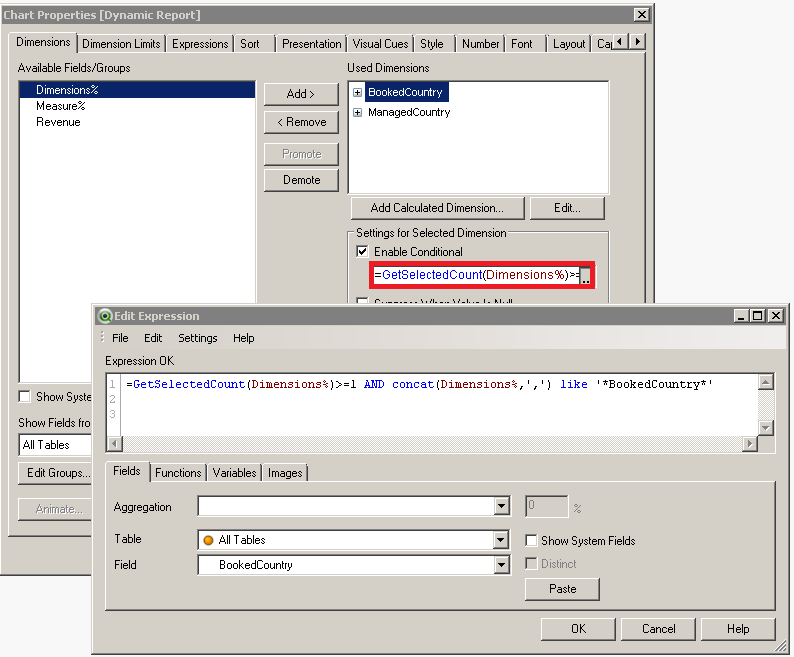
Dimension1: Conditional Expression
=GetSelectedCount(Dimensions%)>=1 AND concat(Dimensions%,',') like '*BookedCountry*'
Dimension2: Conditional Expression
=GetSelectedCount(Dimensions%)>=1 AND concat(Dimensions%,',') like '*ManagedCountry*'
Expression: COnditional Expression
=IsNum( SubStringCount( GetFieldSelections(Measure%), 'Revenue')) and SubStringCount( GetFieldSelections(Measure%), 'Revenue') > 0

Final output,
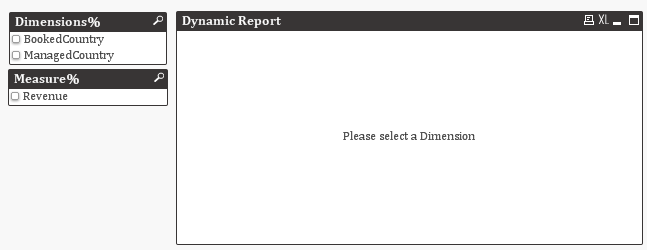
Make any selection, chart will populate....
Hope it helps...
- Mark as New
- Bookmark
- Subscribe
- Mute
- Subscribe to RSS Feed
- Permalink
- Report Inappropriate Content
That is not possible  ...only way i could think is the Direct discovery that is the one option to build the data table dynamically in the script
- « Previous Replies
-
- 1
- 2
- Next Replies »