Unlock a world of possibilities! Login now and discover the exclusive benefits awaiting you.
- Qlik Community
- :
- All Forums
- :
- QlikView App Dev
- :
- Re: Create filter to apply to dual axis chart
- Subscribe to RSS Feed
- Mark Topic as New
- Mark Topic as Read
- Float this Topic for Current User
- Bookmark
- Subscribe
- Mute
- Printer Friendly Page
- Mark as New
- Bookmark
- Subscribe
- Mute
- Subscribe to RSS Feed
- Permalink
- Report Inappropriate Content
Create filter to apply to dual axis chart
I have a set of items which I want to filter from a field in my chart and be able to present a dual axis chart. The challenge is I have to place the field in the Dimensions or it will not display any data.
For my Dimensions I have Date(Days), Field5 (but all I want is just the Date in the X-Axis)
For my line Expression I have input this as the definition: if(field5 like ('*AMT'),sum(item_COUNT),0)
For my bar Expression I have input this as the definition: if(field5 like ('*AMT'),sum(total amt)/1000)
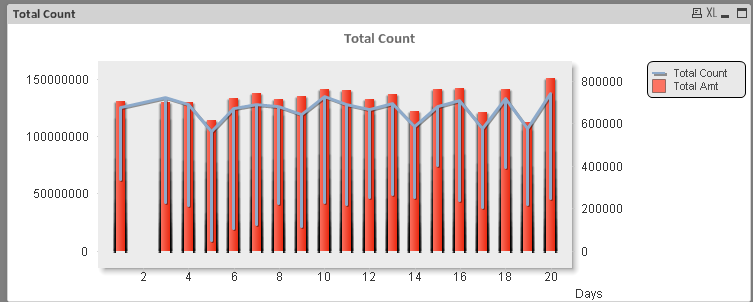
as you can see the line dips for each day because I have both fields for dimensions.
Any help on this would be great.
Thanks,
Allen
Accepted Solutions
- Mark as New
- Bookmark
- Subscribe
- Mute
- Subscribe to RSS Feed
- Permalink
- Report Inappropriate Content
Hi.
You don't have to add field5 as dimension if you just want to filter. Remove it from dimensions and use aggr() function in your expressions like this:
=Sum(aggr(if(field5 like ('*AMT'),sum(item_COUNT),0), field5, Days))
If you understand how the above works, you could try a bit more effective solution with set analysis:
sum({<field5={"*AMT"}>} item_COUNT)
- Mark as New
- Bookmark
- Subscribe
- Mute
- Subscribe to RSS Feed
- Permalink
- Report Inappropriate Content
Thanks that worked great. I will have play around with those, since I am really new at this tool.