Unlock a world of possibilities! Login now and discover the exclusive benefits awaiting you.
- Qlik Community
- :
- All Forums
- :
- QlikView App Dev
- :
- Created revenue for a specific fiscal month
- Subscribe to RSS Feed
- Mark Topic as New
- Mark Topic as Read
- Float this Topic for Current User
- Bookmark
- Subscribe
- Mute
- Printer Friendly Page
- Mark as New
- Bookmark
- Subscribe
- Mute
- Subscribe to RSS Feed
- Permalink
- Report Inappropriate Content
Created revenue for a specific fiscal month
Hi all,
I have a question which is kind of hard to explain, but I'll try.
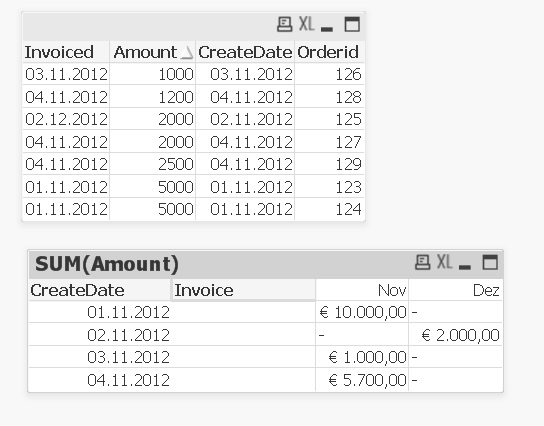
Every day we create orders in our ordersystem. The revenue of this sales will be taken in the month the orders are invoiced. So, we create an order today (Nov-2012), but the revenue is in Dec-2012. We would like to see the created amount of revenue on each day. When doing so we are able to see how much revenue we created in on a specific day in Nov., for the month Nov., Dec., etc.
Let's give me an example (also in QVW file in attachment):

We want to create a line graph which shows me the booked amount of sales in a specific month. That will look like this:

Can someone help me to create something like this? The example is very simple, we would like to make this for a few years of data.
- Mark as New
- Bookmark
- Subscribe
- Mute
- Subscribe to RSS Feed
- Permalink
- Report Inappropriate Content
Hi
Are you expecting something attached file?
Please close the thread by marking correct answer & give likes if you like the post.
- Mark as New
- Bookmark
- Subscribe
- Mute
- Subscribe to RSS Feed
- Permalink
- Report Inappropriate Content
Hi,
just create a new pivot table, add "Createdate" as first Dimension and create a new Dynamic Dimension:
= MONTH(Invoicedate)
Then add a new expression:
SUM (Amount)
Shoulkd look like this:
