Unlock a world of possibilities! Login now and discover the exclusive benefits awaiting you.
- Qlik Community
- :
- All Forums
- :
- QlikView App Dev
- :
- Creating Chart with sub items
- Subscribe to RSS Feed
- Mark Topic as New
- Mark Topic as Read
- Float this Topic for Current User
- Bookmark
- Subscribe
- Mute
- Printer Friendly Page
- Mark as New
- Bookmark
- Subscribe
- Mute
- Subscribe to RSS Feed
- Permalink
- Report Inappropriate Content
Creating Chart with sub items
Hello,
I have a Chart with totals for each order and show the 'Head Item' in the order and the total for the order.
Chart
Table Box wichshould show the sub lines.
The dimension is like this.
My wish is, if I choose one line in the Chart I would like to see the other 'Sub lines' in the order in a 'Table Box' but as it is now only the same line is shown in the 'Table Box'.
kindly
Håkan
The information contained in this communication is confidential, may constitute inside information and is intended only for the use of the addressee. It is the property of Rodenstock GmbH and/or its subsidiaries. Unauthorized use, disclosure, copying or distribution of this communication or any part thereof is strictly prohibited and may be unlawful. If you have received this communication in error, please notify us immediately by return e-mail or by e-mail to info@rodenstock.com and destroy this communication and all copies thereof, including all attachments.
Accepted Solutions
- Mark as New
- Bookmark
- Subscribe
- Mute
- Subscribe to RSS Feed
- Permalink
- Report Inappropriate Content
Hi Håkan,
I've made a little tweak, is this how you mean?
Kind regards
Adam
Please remember to mark this as helpful or the correct answer if I have helped you or answered your question.
- Mark as New
- Bookmark
- Subscribe
- Mute
- Subscribe to RSS Feed
- Permalink
- Report Inappropriate Content
Hi Håkan
It is kind of hard to visualise exactly what you're trying to do here, but I have attached a qvw with a couple of examples which may or may not help.
If you can provide an example qvw that would help us to see what you want to do
Please remember to mark this as helpful or the correct answer if I have helped you or answered your question.
- Mark as New
- Bookmark
- Subscribe
- Mute
- Subscribe to RSS Feed
- Permalink
- Report Inappropriate Content
Hello Adam,
you understood my question, the only thing I would achieve is that when I choose one head
this should remain in the chart and show the details in the table box
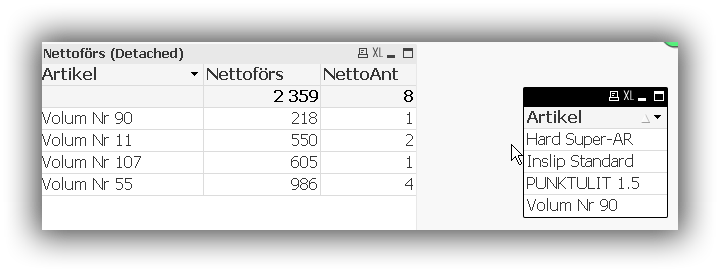
When I click or mark eg Volum Nr 90 should the result be like this, is this possible?
kindly
Håkan
- Mark as New
- Bookmark
- Subscribe
- Mute
- Subscribe to RSS Feed
- Permalink
- Report Inappropriate Content
Hi Håkan,
I've made a little tweak, is this how you mean?
Kind regards
Adam
Please remember to mark this as helpful or the correct answer if I have helped you or answered your question.