Unlock a world of possibilities! Login now and discover the exclusive benefits awaiting you.
- Qlik Community
- :
- All Forums
- :
- QlikView App Dev
- :
- Creating Month Names
- Subscribe to RSS Feed
- Mark Topic as New
- Mark Topic as Read
- Float this Topic for Current User
- Bookmark
- Subscribe
- Mute
- Printer Friendly Page
- Mark as New
- Bookmark
- Subscribe
- Mute
- Subscribe to RSS Feed
- Permalink
- Report Inappropriate Content
Creating Month Names
Hi,
I recently took the qlikview designer and developer classes. I am still quite new.
I have data that has tickets(problem cases) that have submit dates(start dates) and resolved dates(close dates).
It is easy enough to determine the START MONTH NAME and the CLOSED MONTH NAME just from the dates in each of the two fields.
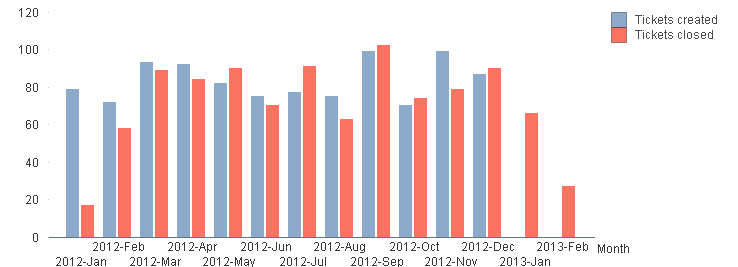
I need a build a bar graph that has month names along the bottom as a dimension, and for the expressions/bars I need to show how many incidents were submitted in that month(start month) and how many were resolved that month(closed month) but the number for resolved month could have submit dates of any previous month.
See the attached example.
The blue bars represent how many tickets were submitted in that month. The red bars represent how many tickets were resolved in that month, regardless of what month they were submitted in(could be any month in the year so far). The green bar represents what was left open which is represented by something similar to (Left open tickets from previous month + new tickets for current month) - Closed tickets for current month.
If someone could help me out with at least getting the New and Resolved tickets into one graph as shown, I'll be more than happy. The Left open tickets I'll figure out sometime.
The challenge I have is that any dimension that I try to set for the month is either tied to the submit date or the closed date, which I do not want. Im thinking some sort of set analysis or statement in the load that declares some static month names that match the month names in the data itself, but does not associate with either submit or resolved. Then some how link them up via name.
Thanks,
Accepted Solutions
- Mark as New
- Bookmark
- Subscribe
- Mute
- Subscribe to RSS Feed
- Permalink
- Report Inappropriate Content
You need to create a generic date - a date that covers both the creation and the closing of a ticket. I made a small mock-up: see attachment.
With the generic date, you can plot number of created tickets and number of closed tickets in the same chart.
The formulae used are
Count (distinct if(IsCreated, TicketID))
Count (distinct if(not IsCreated, TicketID))
HIC
- Mark as New
- Bookmark
- Subscribe
- Mute
- Subscribe to RSS Feed
- Permalink
- Report Inappropriate Content
hi create an inline table for month with monthnames, quarter and tie it to the the date table of the datamodel..
for the three graphs u need to write the 3 expressions and use grouped from style tab then u will get the result..
it will be easy if u can attach a sample file...
thanks
- Mark as New
- Bookmark
- Subscribe
- Mute
- Subscribe to RSS Feed
- Permalink
- Report Inappropriate Content
Hi,
Unsure how to attach my QVW into a reply here.
Im looking through my notes from the class and I know we did inline, just cant find it!
- Mark as New
- Bookmark
- Subscribe
- Mute
- Subscribe to RSS Feed
- Permalink
- Report Inappropriate Content
You need to create a generic date - a date that covers both the creation and the closing of a ticket. I made a small mock-up: see attachment.
With the generic date, you can plot number of created tickets and number of closed tickets in the same chart.
The formulae used are
Count (distinct if(IsCreated, TicketID))
Count (distinct if(not IsCreated, TicketID))
HIC
- Mark as New
- Bookmark
- Subscribe
- Mute
- Subscribe to RSS Feed
- Permalink
- Report Inappropriate Content
Hi this looks like it will help however, I am very new to qlikview and having trouble understanding what you did.
Ticket created date = Actual Start
Ticket closed date = Actual Finish
Ive created two other fields, Submitted_Month_Name <- Actual Start , and Closed_Month_Name <-Actual Finish.
I tried plugging in actual start and actual finish into where I thougth was appropriate areas in your code but it was not working.
- Mark as New
- Bookmark
- Subscribe
- Mute
- Subscribe to RSS Feed
- Permalink
- Report Inappropriate Content
Can you post your script? (You need to click the "Use advanced editor" to attach files.)
HIC
- Mark as New
- Bookmark
- Subscribe
- Mute
- Subscribe to RSS Feed
- Permalink
- Report Inappropriate Content
Attached my script with my date fields plugged in.
- Mark as New
- Bookmark
- Subscribe
- Mute
- Subscribe to RSS Feed
- Permalink
- Report Inappropriate Content
My "Tickets" table is just a mock-up. You should replace the entire table with whatever data you have.
The "CalendarBridge" looks OK in your script - provided that your "Tickets" table contains the fields TicketID, Actual Start] and [Actual Finish].
HIC
- Mark as New
- Bookmark
- Subscribe
- Mute
- Subscribe to RSS Feed
- Permalink
- Report Inappropriate Content
Hi, I think I got it. I realize what you did with autogenerate. Took that stuff out. Renamed the resident table(duh).
Looks pretty close. The Is not created is off by one each time, but I dont think thats a huge deal unless you know why that is happening. It is short by one ticket each time, compared to the actual data. If there are 812 closed tickets, qlikview tells me there are only 811.
Either way, I thank you for your help. We have many charts like this and Im going to put this to good use.