Unlock a world of possibilities! Login now and discover the exclusive benefits awaiting you.
- Qlik Community
- :
- All Forums
- :
- QlikView App Dev
- :
- Re: Creating New field based on other field.
- Subscribe to RSS Feed
- Mark Topic as New
- Mark Topic as Read
- Float this Topic for Current User
- Bookmark
- Subscribe
- Mute
- Printer Friendly Page
- Mark as New
- Bookmark
- Subscribe
- Mute
- Subscribe to RSS Feed
- Permalink
- Report Inappropriate Content
Creating New field based on other field.
Hi Qlik Users,
I have sample data in below format.
| Snapshot_id | No_of_points | test_points | number_of_periods | samples_per_period |
| 1 | 4 | 1.1 1.22 1.3 1.4444 | 0 | |
| 2 | 8 | 2.1 2.2 2.333 2.4 2.5 2.6 2.7 2.2 | 4 | 2 |
| 3 | 8 | 3.1 3.22 3.3 3.4 3.55555 3.6 3.77 3.888 | 8 | 1 |
| 4 | 4 | 4.1 4.22 4.22 4.33 | 4 | 1 |
| 5 | 4 | 5.1 5.2 5.333 5.4 | 1 | 4 |
and I need the output to be as below.
| Snapshot_id | Degree | test_points | Period | No_of_points | number_of_periods | samples_per_period |
| 1 | 1 | 1.1 | Period-1 | 4 | 0 | |
| 1 | 2 | 1.22 | Period-1 | 4 | 0 | |
| 1 | 3 | 1.3 | Period-1 | 4 | 0 | |
| 1 | 4 | 1.4444 | Period-1 | 4 | 0 | |
| 2 | 1 | 2.1 | Period-1 | 8 | 4 | 2 |
| 2 | 2 | 2.2 | Period-1 | 8 | 4 | 2 |
| 2 | 3 | 2.333 | Period-2 | 8 | 4 | 2 |
| 2 | 4 | 2.4 | Period-2 | 8 | 4 | 2 |
| 2 | 5 | 2.5 | Period-3 | 8 | 4 | 2 |
| 2 | 6 | 2.6 | Period-3 | 8 | 4 | 2 |
| 2 | 7 | 2.7 | Period-4 | 8 | 4 | 2 |
| 2 | 8 | 2.2 | Period-4 | 8 | 4 | 2 |
| 3 | 1 | 3.1 | Period-1 | 8 | 8 | 1 |
| 3 | 2 | 3.22 | Period-2 | 8 | 8 | 1 |
| 3 | 3 | 3.3 | Period-3 | 8 | 8 | 1 |
| 3 | 4 | 3.4 | Period-4 | 8 | 8 | 1 |
| 3 | 5 | 3.55555 | Period-5 | 8 | 8 | 1 |
| 3 | 6 | 3.6 | Period-6 | 8 | 8 | 1 |
| 3 | 7 | 3.77 | Period-7 | 8 | 8 | 1 |
| 3 | 8 | 3.888 | Period-8 | 8 | 8 | 1 |
| 4 | 1 | 4.1 | Period-1 | 4 | 4 | 1 |
| 4 | 2 | 4.22 | Period-2 | 4 | 4 | 1 |
| 4 | 3 | 4.22 | Period-3 | 4 | 4 | 1 |
| 4 | 4 | 4.33 | Period-4 | 4 | 4 | 1 |
| 5 | 1 | 5.1 | Period-1 | 4 | 1 | 4 |
| 5 | 2 | 5.2 | Period-1 | 4 | 1 | 4 |
| 5 | 3 | 5.333 | Period-1 | 4 | 1 | 4 |
| 5 | 4 | 5.4 | Period-1 | 4 | 1 | 4 |
I have created the field Degree using Autonumber(RowNo, Snapshot_id) ,but I need script to create the field Period. How can I do it ? number_of_periods defines the periods in each snapshot_id and samples_per_period defines the number of degree's per period in each snapshot_id. Can someone help with script for creating the field Period ?
Thanks,
Raj
Accepted Solutions
- Mark as New
- Bookmark
- Subscribe
- Mute
- Subscribe to RSS Feed
- Permalink
- Report Inappropriate Content
A:
LOAD Distinct Snapshot_id,
No_of_points,
(SubField(test_points,' ' )) as test_points,
number_of_periods,
samples_per_period,
RowNo() as RowNo
FROM
(ooxml, embedded labels, table is Sheet2);
B:
Load AutoNumber(RowNo, Snapshot_id) as Degree,
Snapshot_id,
No_of_points,
test_points,
RowNo,
number_of_periods,
if(IsNull(samples_per_period),No_of_points,samples_per_period) as samples_per_period
Resident A;
DROP Table A;
C:
LOAD *,
'Period'&'-'&Ceil(Degree/samples_per_period) as Period
Resident B;
DROP Table B;
- Mark as New
- Bookmark
- Subscribe
- Mute
- Subscribe to RSS Feed
- Permalink
- Report Inappropriate Content
Not entirely sure how you are creating the Period field... but rest can be done like this....
Table:
LOAD Snapshot_id,
No_of_points,
AutoNumber(RowNo(), Snapshot_id) as Degree,
SubField(test_points, ' ') as test_points,
number_of_periods,
samples_per_period;
LOAD * INLINE [
Snapshot_id, No_of_points, test_points, number_of_periods, samples_per_period
1, 4, 1.1 1.22 1.3 1.4444, 0
2, 8, 2.1 2.2 2.333 2.4 2.5 2.6 2.7 2.2, 4, 2
3, 8, 3.1 3.22 3.3 3.4 3.55555 3.6 3.77 3.888, 8, 1
4, 4, 4.1 4.22 4.22 4.33, 4, 1
5, 4, 5.1 5.2 5.333 5.4, 1, 4
];
- Mark as New
- Bookmark
- Subscribe
- Mute
- Subscribe to RSS Feed
- Permalink
- Report Inappropriate Content
I need the Period field. I have achieved rest of transform in the table.
- Mark as New
- Bookmark
- Subscribe
- Mute
- Subscribe to RSS Feed
- Permalink
- Report Inappropriate Content
Hahahaha okay... what is the logic?
- Mark as New
- Bookmark
- Subscribe
- Mute
- Subscribe to RSS Feed
- Permalink
- Report Inappropriate Content
Here you go.
number_of_periods defines the periods in each snapshot_id and samples_per_period defines the number of degree's per period in each snapshot_id.
- Mark as New
- Bookmark
- Subscribe
- Mute
- Subscribe to RSS Feed
- Permalink
- Report Inappropriate Content
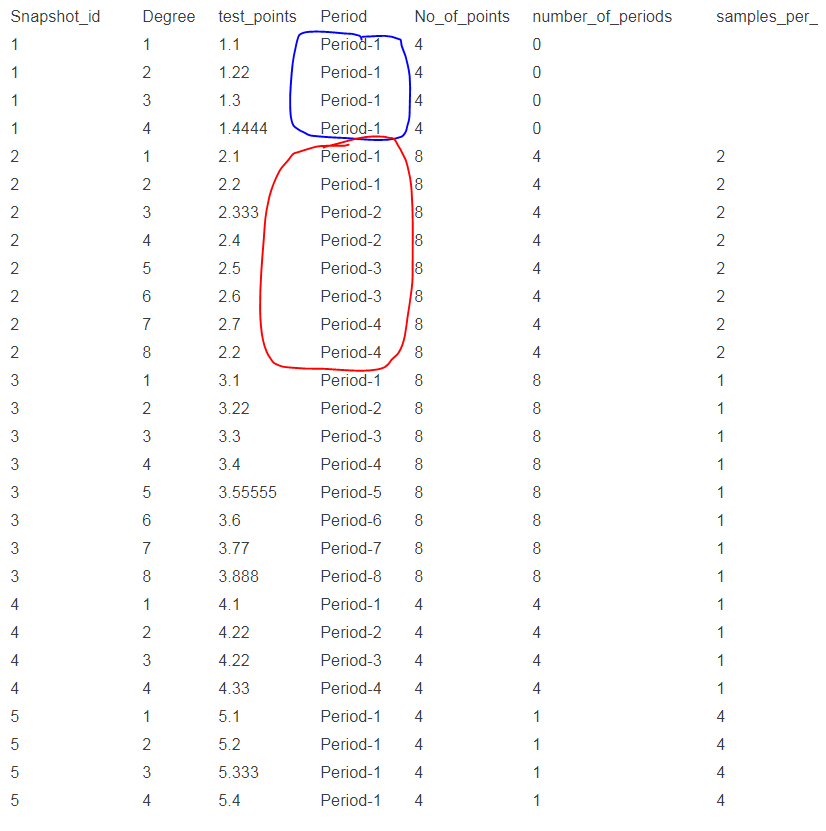
Don't think I understand still... Why is everything within blue circle is all Period-1, but the other one changes?
- Mark as New
- Bookmark
- Subscribe
- Mute
- Subscribe to RSS Feed
- Permalink
- Report Inappropriate Content
When Snapshot_id = '1', No_of_points = '4' tells total degree's as 1,2,3,4. since Number_of_periods = '0' its considered as 1 period so all blue is period-1 for snapshot_id = '1'.
When Snapshot_id = '2' , No_of_points = '8' so the degree = 1,2,3,4,5,6,7,8. other field which shows Number_of_periods = '4' in that snapshot_id = '2'. So the other field shows samples_per_period = '2'. So When snapshot_id ='2' you have 4 periods taking every two degrees as one period.
Similarly, each snapshot_id has total number of degrees per period and samples per period.
- Mark as New
- Bookmark
- Subscribe
- Mute
- Subscribe to RSS Feed
- Permalink
- Report Inappropriate Content
A:
LOAD Distinct Snapshot_id,
No_of_points,
(SubField(test_points,' ' )) as test_points,
number_of_periods,
samples_per_period,
RowNo() as RowNo
FROM
(ooxml, embedded labels, table is Sheet2);
B:
Load AutoNumber(RowNo, Snapshot_id) as Degree,
Snapshot_id,
No_of_points,
test_points,
RowNo,
number_of_periods,
if(IsNull(samples_per_period),No_of_points,samples_per_period) as samples_per_period
Resident A;
DROP Table A;
C:
LOAD *,
'Period'&'-'&Ceil(Degree/samples_per_period) as Period
Resident B;
DROP Table B;