Unlock a world of possibilities! Login now and discover the exclusive benefits awaiting you.
- Qlik Community
- :
- All Forums
- :
- QlikView App Dev
- :
- Re: Creating a Pyramid Chart
- Subscribe to RSS Feed
- Mark Topic as New
- Mark Topic as Read
- Float this Topic for Current User
- Bookmark
- Subscribe
- Mute
- Printer Friendly Page
- Mark as New
- Bookmark
- Subscribe
- Mute
- Subscribe to RSS Feed
- Permalink
- Report Inappropriate Content
Creating a Pyramid Chart
how to use pyramid chart in qlikview and to change values dynamically if iam having listbox of 10 years
- Tags:
- new_to_qlikview
- Mark as New
- Bookmark
- Subscribe
- Mute
- Subscribe to RSS Feed
- Permalink
- Report Inappropriate Content
Hey hi,
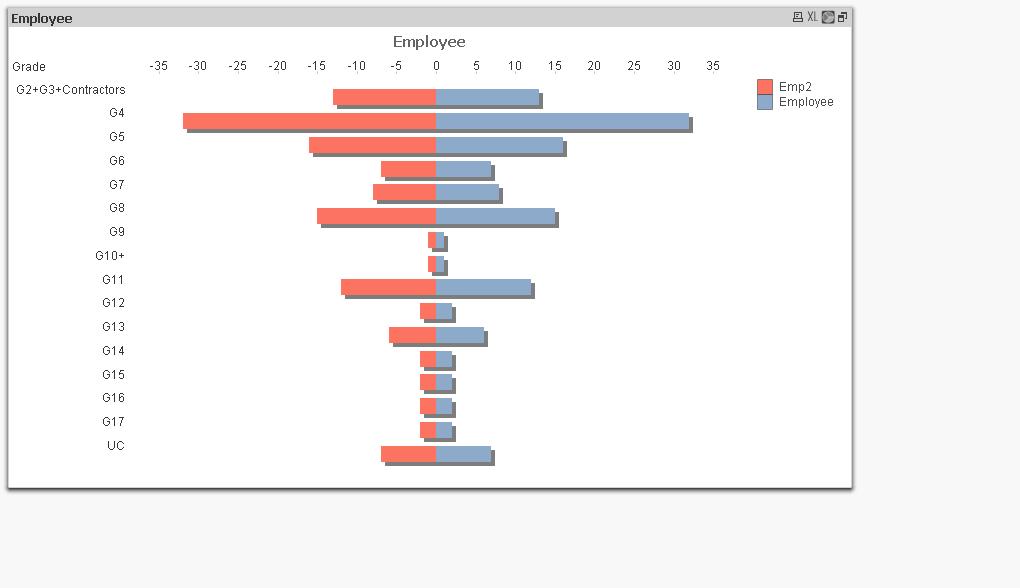
May be this type of chart you are talking about.
Kindly check and revert back.
Regards
- Mark as New
- Bookmark
- Subscribe
- Mute
- Subscribe to RSS Feed
- Permalink
- Report Inappropriate Content
hi rahul,
i got that pyramid chart by using two expression and i selected properties->style->stacked...........

- Mark as New
- Bookmark
- Subscribe
- Mute
- Subscribe to RSS Feed
- Permalink
- Report Inappropriate Content
Taking viduthalai's version a little further, it is possible to show a style of pyramid.
If you
- sort by y value - decending
- have the same colour for both the positive and negative mirror
- high the x axis
- only show values on data points for the positive element
- Disable popup lables (presentation tab)
You should end up with what you're looking for. Of course there are a few downsides to this approach.
- if you export the data you will see both positive and negative values
- fast changing to a pivot will also show both expresions.
Regards,
Pete
- Mark as New
- Bookmark
- Subscribe
- Mute
- Subscribe to RSS Feed
- Permalink
- Report Inappropriate Content
Hi fellow qlikers and viewers
I am trying to create a pyramid chart and just wondered if anyone had figured out how to remove the '-' aspect of the data point when "Values on Data Points" is enabled?
Thanks in adnvance
- Mark as New
- Bookmark
- Subscribe
- Mute
- Subscribe to RSS Feed
- Permalink
- Report Inappropriate Content
If you want to remove the negative sign of the value on data points, you can use a number format code for the expression, where the neagtive part equals the positive part, for an integer it might look like
#,##0;#,##0
(set this format in number tab)
To change also the appearance of the axis labels, I think I needed to set a static step in axes tab.
Hope this helps,
Stefan
- Mark as New
- Bookmark
- Subscribe
- Mute
- Subscribe to RSS Feed
- Permalink
- Report Inappropriate Content
thank you swuehl, this worked like a treat.
many thanks
- Mark as New
- Bookmark
- Subscribe
- Mute
- Subscribe to RSS Feed
- Permalink
- Report Inappropriate Content
See the qvw file
Regards,
Khadeer
- Mark as New
- Bookmark
- Subscribe
- Mute
- Subscribe to RSS Feed
- Permalink
- Report Inappropriate Content
thank you so much for your resp9onses