Unlock a world of possibilities! Login now and discover the exclusive benefits awaiting you.
- Qlik Community
- :
- All Forums
- :
- QlikView App Dev
- :
- Re: Creating a combo chart with one line and two b...
- Subscribe to RSS Feed
- Mark Topic as New
- Mark Topic as Read
- Float this Topic for Current User
- Bookmark
- Subscribe
- Mute
- Printer Friendly Page
- Mark as New
- Bookmark
- Subscribe
- Mute
- Subscribe to RSS Feed
- Permalink
- Report Inappropriate Content
Creating a combo chart with one line and two bars
Hi everyone,
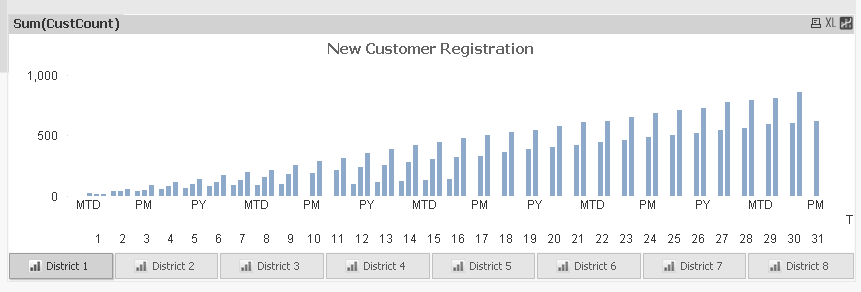
I am new to QlikView and I am trying to create a combo chart to cumulatively sum the number of new customers this month (MTD), last month (PM), and last year (PY) with the following properties:
There are 8 districts. I have created a container with a tab for each district. So for District 1, for example, I want to use a combo chart to show the cumulative total of new customers in District 1 for MTD (line chart), PM (bar chart), and PY (bar chart). I am having trouble with the expressions because the only one I have is sum(customercount). I then use the accumulate feature on the Expressions tab to get the cumulative total (I'm sure there is a better way?). I don't know how to fix the combo chart for these three variables and to tell QlikView that the line is the MTD and the two bars are for PM and PY. I also want a legend for MTD, PM, and PY instead of having these labels on the x axis as well as a different color to represent each one. The screenshot below shows the current state of my chart.
I have a lot of issues... I appreciate any help you can give me.
Thank you!
Melanie
- Tags:
- new_to_qlikview
- Mark as New
- Bookmark
- Subscribe
- Mute
- Subscribe to RSS Feed
- Permalink
- Report Inappropriate Content
You definitely need three expressions to show a combo with two bars and one line. So you need to work in a different way.
Can you post a sample qvw file?
- Mark as New
- Bookmark
- Subscribe
- Mute
- Subscribe to RSS Feed
- Permalink
- Report Inappropriate Content
Agis,
Thanks for your reply. I've attached a sample file.
On Thu, Jun 18, 2015 at 5:38 PM, Agis Kalogiannis <qcwebmaster@qlikview.com>
- Mark as New
- Bookmark
- Subscribe
- Mute
- Subscribe to RSS Feed
- Permalink
- Report Inappropriate Content
Hi Melanie
Thank you for the sample file.
I think that this is what you want.
I've modified just the District 1 chart, leaving the rest to you. 🙂
Please let me know if you need anything else.
Regards
Agis
- Mark as New
- Bookmark
- Subscribe
- Mute
- Subscribe to RSS Feed
- Permalink
- Report Inappropriate Content
Thanks, Agis. I notice that there is only MTD in the Time Period list box.
I can't view the PM and PY on the chart...only MTD. I need to view all
three expressions at once. Am I not enabling something?
Thanks,
Melanie
On Sun, Jun 21, 2015 at 2:52 PM, Agis Kalogiannis <qcwebmaster@qlikview.com>
- Mark as New
- Bookmark
- Subscribe
- Mute
- Subscribe to RSS Feed
- Permalink
- Report Inappropriate Content
Never mind! There was something wrong with my SQL query that told
everything to come in as MTD. I fixed it and now I can see all three
expressions on the chart.
On Mon, Jun 22, 2015 at 10:30 AM, Melanie Smith <melanie.smith@af247.com>
- Mark as New
- Bookmark
- Subscribe
- Mute
- Subscribe to RSS Feed
- Permalink
- Report Inappropriate Content
Hi Melanie
Glad I could help.
Could you please mark the answer as Helpful or Correct so as to close the discussion?
Thanks
Agis