- Mark as New
- Bookmark
- Subscribe
- Mute
- Subscribe to RSS Feed
- Permalink
- Report Inappropriate Content
Creation of two horizontal lines inside a line chart
Hi All,
I would like your support on an issue that I have been facing for the past week. The graph that I created below is a representation of two fictive datasets with each means in a different colour and the confidence interval to see if their variation + mean is similar. (Apologies I cannot attach the file)
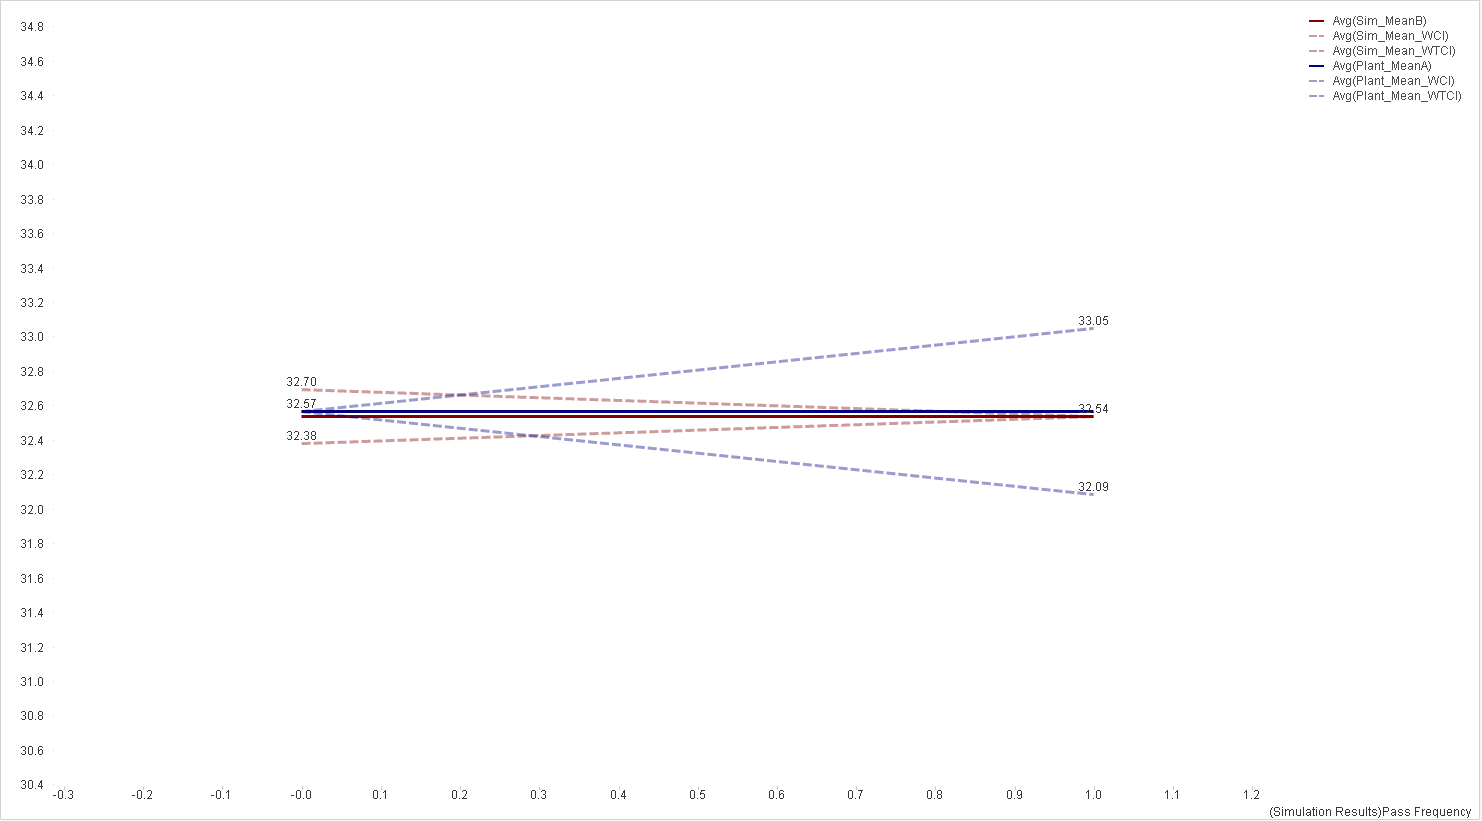
My Goal is to create a line between the two blue extremities and the two red extremities. (Point 33.05 with 32.09 and point 32.70 with 32.38). This line should be vertical. I have no variable calculated or anything in the script, the graph consists of a dimension that is there only to stretch the data (the X axis does not add any value to the graph and is there just to have a 0 to 1 range with 0.1 increments to stretch the lines, It is hidden once I finish with the graph). The only thing in this is graph are 6 expressions, 2 for the means and 4 for the confidence +- the mean for each dataset.
It should optimally look like this:
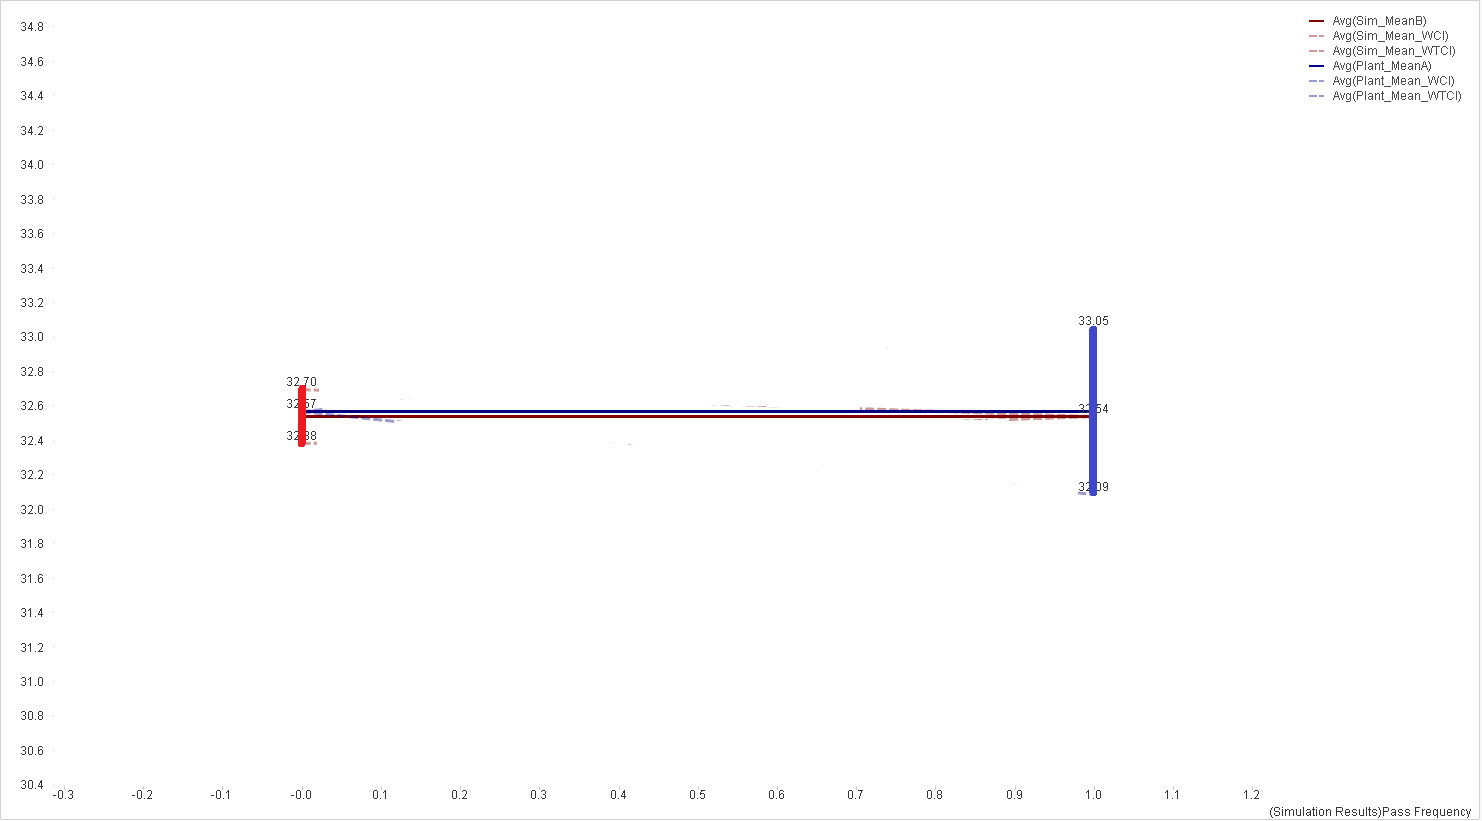
Once I have those lines I will hide the dashed line.
Any strategy or method is fair game, I'm open to any suggestion.
Thanks
- Mark as New
- Bookmark
- Subscribe
- Mute
- Subscribe to RSS Feed
- Permalink
- Report Inappropriate Content
Hi All, could anyone support on this? It is quite urgent.
Thank you.