Unlock a world of possibilities! Login now and discover the exclusive benefits awaiting you.
- Qlik Community
- :
- All Forums
- :
- QlikView App Dev
- :
- Crosstab Data Structure
- Subscribe to RSS Feed
- Mark Topic as New
- Mark Topic as Read
- Float this Topic for Current User
- Bookmark
- Subscribe
- Mute
- Printer Friendly Page
- Mark as New
- Bookmark
- Subscribe
- Mute
- Subscribe to RSS Feed
- Permalink
- Report Inappropriate Content
Crosstab Data Structure
I am trying to create a dashboard with interactive data (i.e. clicking one table also updates the other table). I'm quite a newbie with Qlikview and need some guidance.
I have a main data file, which I've attached as a shortened version. Upon uploading the data, I crosstab all the information and have the following script (my version will be slightly longer):
CrossTable(QUESTIONS, Data, 4)
LOAD respid,
COUNTRY,
ID,
Cluster,
q8,
q11_1,
q11_2,
q11_3,
q11_4,
q11_5,
q11_6,
q11_7,
q11_8,
q11_9,
q11_10,
q11_12,
q11_13,
q11_15,
q11_16,
q11_17,
q11_18,
q11_19,
q11_20,
q11_21,
q11_22,
q11_23,
q11_24,
q11_25,
q11_26,
q11_28,
q11_30,
q11_31,
q11_32,
q11_33,
q11_35,
q11_36,
q11_37,
q11_38,
q11_avg,
q12_1,
q12_2,
q12_3,
q12_4,
q12_5,
q12_6,
q12_7,
q12_8,
q12_9,
q12_10,
q12_11,
q12_12,
q12_13,
q12_14,
q12_15,
q12_16,
q12_17,
q12_18,
q12_19,
q12_20,
q13_1,
q13_2,
q13_3,
q13_4,
q13_5,
q13_6,
q13_7,
q13_8,
q13_9,
q13_10,
q13_11,
q14,
FROM
xxxx
After this step, I'm stuck as to do what to do. I'm looking to create two separate straight tables with all of Q12 in one table (i.e.q12_1,q12_2,q12_3 etc), and similarly all of Q11 in another straight table with all of Q11 (q11_1,q11_2,q11_3... etc) with both of them being able to interact to each other such that when I click on data in the Q12 table, the Q11 table also populates.
How can I achieve the two separate straight tables without doing set analysis at the straight table stage and rather at the scripting level?
Thanks in advance.
- « Previous Replies
-
- 1
- 2
- Next Replies »
- Mark as New
- Bookmark
- Subscribe
- Mute
- Subscribe to RSS Feed
- Permalink
- Report Inappropriate Content
Hi Tanya:
I think that you can mahe this:
Q11:
LOAD respid,
Country,
Cluster,
q11_1,
q11_2,
q11_3,
q11_4,
q11_5,
q11_6,
q11_7,
q11_8,
q11_9,
q11_10,
q11_12,
q11_13,
q11_15,
q11_16,
q11_17,
q11_18,
q11_19,
q11_20,
q11_21,
q11_22,
q11_23,
q11_24,
q11_25,
q11_26,
q11_28,
q11_30,
q11_31,
q11_32,
q11_33,
q11_35,
q11_36,
q11_37,
q11_38
FROM
[...]
Q12:
LOAD respid,
q12_1,
q12_2,
q12_3,
q12_4,
q12_5,
q12_6,
q12_7,
q12_8,
q12_9,
q12_10,
q12_11,
q12_12,
q12_13,
q12_14,
q12_15,
q12_16,
q12_17,
q12_18,
q12_19,
q12_20
FROM
[...]
If you need more information, ask it.
Regards
Miguel del Valle
- Mark as New
- Bookmark
- Subscribe
- Mute
- Subscribe to RSS Feed
- Permalink
- Report Inappropriate Content
Hi Miguel,
Thanks for your help. So now I've got my script looking like this:
Fact:
LOAD respid,
Facts,
F_Data
FROM
Q11:
LOAD respid,
Lifecycle,
Data
FROM
Q12:
LOAD respid,
Marital,
Q12Data
FROM
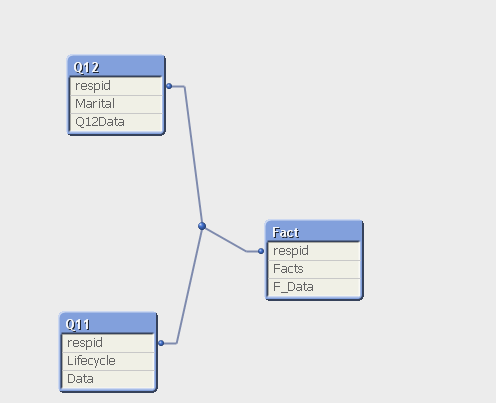
They're all now linked by the unique respid which is great.
However, now I need help with clicking on the tables. When I click on things in one table, it doesn't populate in the other table and I believe this might due to a problem with my expression in the pivot table.
My expression for Q11 is:
sum(Data)
And expression for Q12 is:
sum(Q12Data)
However, the data is not interactive.
- Mark as New
- Bookmark
- Subscribe
- Mute
- Subscribe to RSS Feed
- Permalink
- Report Inappropriate Content
Hi Tanya,
Colud you send me a picture of your Table viewer?
Regards
Miguel del valle
- Mark as New
- Bookmark
- Subscribe
- Mute
- Subscribe to RSS Feed
- Permalink
- Report Inappropriate Content

- Mark as New
- Bookmark
- Subscribe
- Mute
- Subscribe to RSS Feed
- Permalink
- Report Inappropriate Content
Hi Tanya,
What dimension are you using? respid?
Regards
Miguel del Valle
- Mark as New
- Bookmark
- Subscribe
- Mute
- Subscribe to RSS Feed
- Permalink
- Report Inappropriate Content
Hi Miguel,
My expression for Q11 is:
sum(Data)
Using lifecycle as a dimension
And expression for Q12 is:
sum(Q12Data)
Using Marital as a dimension
Is there a better way I should be doing this?
- Mark as New
- Bookmark
- Subscribe
- Mute
- Subscribe to RSS Feed
- Permalink
- Report Inappropriate Content
I would load the data like you already have with the crosstable, and then use a set expression to select the q11 and q12 responses
Sum({<QUESTIONS = {'q11_*'}>} Data)
Sum({<QUESTIONS = {'q12_*'}>} Data)
If you want to break that downs into individual questions, then add QUESTIONS as a dimension to your table.
- Mark as New
- Bookmark
- Subscribe
- Mute
- Subscribe to RSS Feed
- Permalink
- Report Inappropriate Content
Hi Jonathan,
I tried doing this except the set analysis means that when I click on numbers within table of Q11, the numbers in Q12 table don't update.
- Mark as New
- Bookmark
- Subscribe
- Mute
- Subscribe to RSS Feed
- Permalink
- Report Inappropriate Content
I suggest that you upload a sample qvw file to clealy illustrate the problem. I am not clear how or why you want the Q12 numbers to update when you select a value from the Q11 table.
- « Previous Replies
-
- 1
- 2
- Next Replies »