Unlock a world of possibilities! Login now and discover the exclusive benefits awaiting you.
- Qlik Community
- :
- All Forums
- :
- QlikView App Dev
- :
- Cumilative evolution
- Subscribe to RSS Feed
- Mark Topic as New
- Mark Topic as Read
- Float this Topic for Current User
- Bookmark
- Subscribe
- Mute
- Printer Friendly Page
- Mark as New
- Bookmark
- Subscribe
- Mute
- Subscribe to RSS Feed
- Permalink
- Report Inappropriate Content
Cumilative evolution
hey all,
if i want to show a line chart that shows a cumilative amount evolution by month-year
ex: jan-2016 5000
Feb-2016. 4000
need to show on a line chart :
jan-2016. 5000
feb-2016. 9000
hope you can help
thank you
- Mark as New
- Bookmark
- Subscribe
- Mute
- Subscribe to RSS Feed
- Permalink
- Report Inappropriate Content
hi,
rangesum(above(sum({$< yearmonth={'value'}>}filed),0,rowno()))
- Mark as New
- Bookmark
- Subscribe
- Mute
- Subscribe to RSS Feed
- Permalink
- Report Inappropriate Content
- Mark as New
- Bookmark
- Subscribe
- Mute
- Subscribe to RSS Feed
- Permalink
- Report Inappropriate Content
is this work for the whole year ? since as i can see i have to put the value of yearmonth
?
- Mark as New
- Bookmark
- Subscribe
- Mute
- Subscribe to RSS Feed
- Permalink
- Report Inappropriate Content
Would you be accumulating it for just the year and then on January the accumulation resets? Is that your goal?
- Mark as New
- Bookmark
- Subscribe
- Mute
- Subscribe to RSS Feed
- Permalink
- Report Inappropriate Content
hi sunny yes exactly is this possible? But i can still see it aa cumulative in the previous year?
- Mark as New
- Bookmark
- Subscribe
- Mute
- Subscribe to RSS Feed
- Permalink
- Report Inappropriate Content
I think this is possible, let me see if I can get a sample for you.
- Mark as New
- Bookmark
- Subscribe
- Mute
- Subscribe to RSS Feed
- Permalink
- Report Inappropriate Content
Something like this?
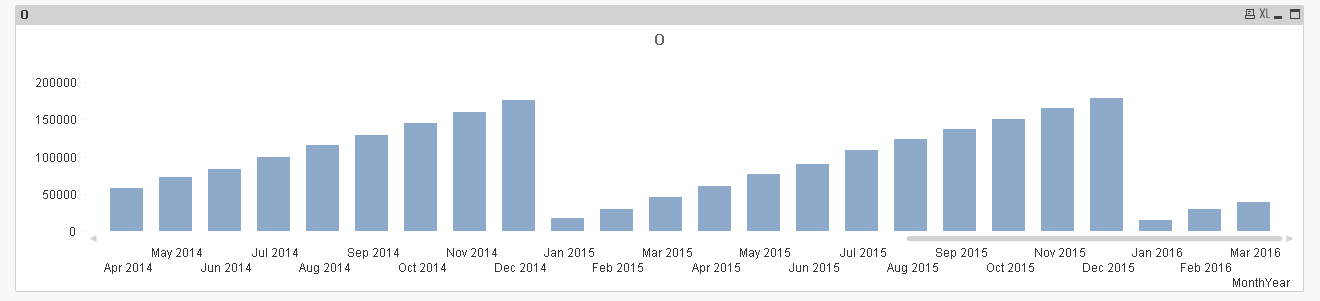
Sample Script used:
Table:
LOAD Date,
Month(Date) as Month,
Num(Month(Date)) as MonthNum,
Year(Date) as Year,
MonthName(Date) as MonthYear,
Sales;
LOAD Date(MakeDate(2009, 12, 31) + RecNo()) as Date,
Ceil(Rand() * 100) * 10 as Sales
AutoGenerate Today() - MakeDate(2009, 12, 31);
Expression: =RangeSum(Above(Sum(Sales), 0, MonthNum))
Dimension: MonthYear