Unlock a world of possibilities! Login now and discover the exclusive benefits awaiting you.
- Qlik Community
- :
- All Forums
- :
- QlikView App Dev
- :
- Re: Cumm Sales Calculation
- Subscribe to RSS Feed
- Mark Topic as New
- Mark Topic as Read
- Float this Topic for Current User
- Bookmark
- Subscribe
- Mute
- Printer Friendly Page
- Mark as New
- Bookmark
- Subscribe
- Mute
- Subscribe to RSS Feed
- Permalink
- Report Inappropriate Content
Cumm Sales Calculation
Hi All,
I want show Sales values as below:
JAN Sales=JAN Sales
FEB Sales=JAN Sales + FEB Sales
MAR Sales=JAN Sales + FEB Sales +MAR Sales
.
.
.
DEC Sales=JAN Sales + FEB Sales +MAR Sales+....+ DEC Sales.
By Default, want to show the data untill current month.
Please help me.
Accepted Solutions
- Mark as New
- Bookmark
- Subscribe
- Mute
- Subscribe to RSS Feed
- Permalink
- Report Inappropriate Content
Here you go !
- Mark as New
- Bookmark
- Subscribe
- Mute
- Subscribe to RSS Feed
- Permalink
- Report Inappropriate Content
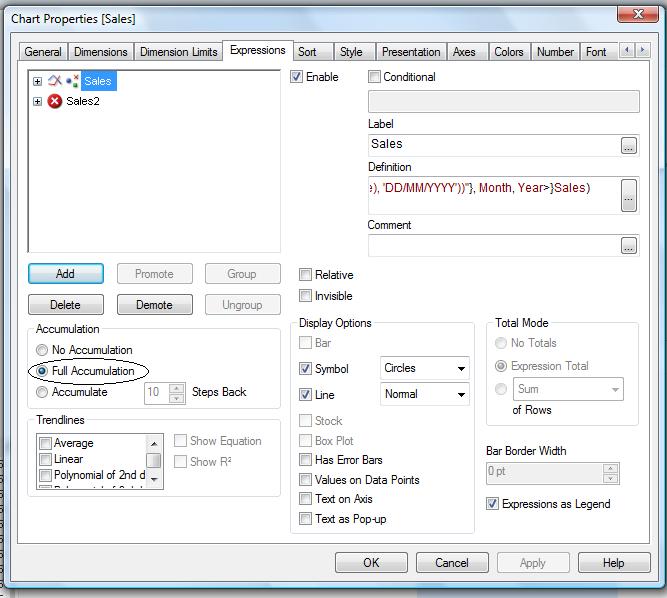
In the chart select "Full Accumulation" as shown in the screen shot below:

- Mark as New
- Bookmark
- Subscribe
- Mute
- Subscribe to RSS Feed
- Permalink
- Report Inappropriate Content
If I select Full Accumulation,
If there is no value for the month, it is showing previous month Sales.
I want to show until SEP.
- Mark as New
- Bookmark
- Subscribe
- Mute
- Subscribe to RSS Feed
- Permalink
- Report Inappropriate Content
Like This
- Mark as New
- Bookmark
- Subscribe
- Mute
- Subscribe to RSS Feed
- Permalink
- Report Inappropriate Content
Hi
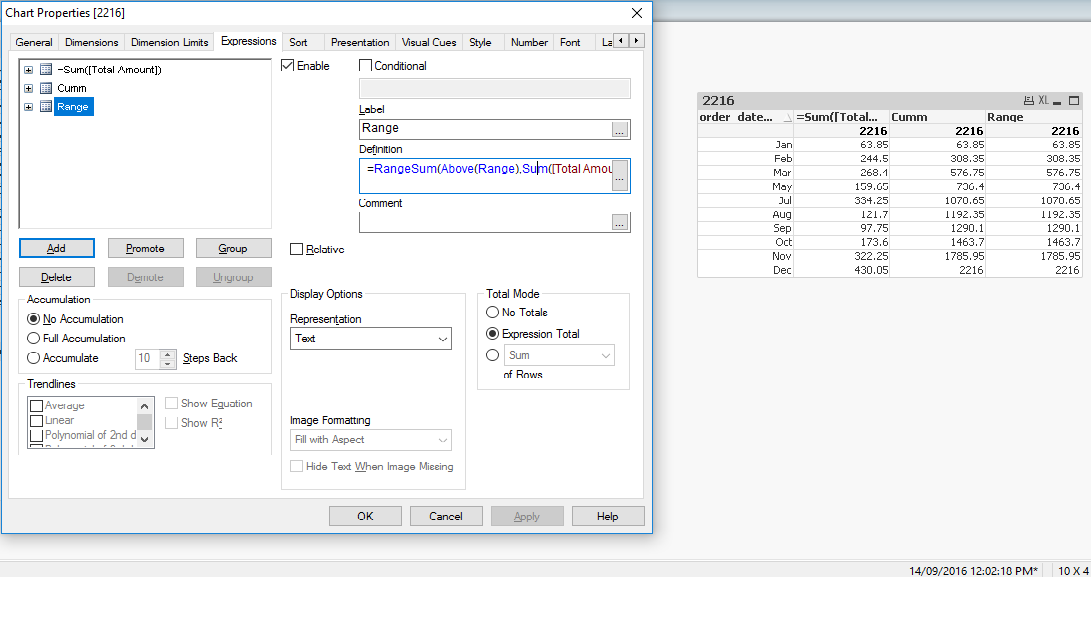
You can either use the "Full Accumulation" option or else you can use Rangesum and above functions as shown below:
=RangeSum(Above(Range),Sum([Total Amount]))

- Mark as New
- Bookmark
- Subscribe
- Mute
- Subscribe to RSS Feed
- Permalink
- Report Inappropriate Content
Hi,
Check is this your'e looking for,
By using this expressions and UN-checking full accumulation at both expressions,
1.
IF(Sum({<Date = {"$(='>=' & Date(YearStart(Max(Date)), 'DD/MM/YYYY') & '<=' & Date(Max(Date), 'DD/MM/YYYY'))"}, Month, Year>}Sales),
Rangesum(Sum({<Date = {"$(='>=' & Date(YearStart(Max(Date)), 'DD/MM/YYYY') & '<=' & Date(Max(Date), 'DD/MM/YYYY'))"}, Month, Year>}Sales),Above("Sales1")))
2.
If(Sum({<Date = {"$(='>=' & Date(YearStart(Max(Date)), 'DD/MM/YYYY') & '<=' & Date(Max(Date), 'DD/MM/YYYY'))"}, Month, Year>}Sales2),
Rangesum(Sum({<Date = {"$(='>=' & Date(YearStart(Max(Date)), 'DD/MM/YYYY') & '<=' & Date(Max(Date), 'DD/MM/YYYY'))"}, Month, Year>}Sales2),Above("Sales 2")))
HTH,
PFA,
Hirish
- Mark as New
- Bookmark
- Subscribe
- Mute
- Subscribe to RSS Feed
- Permalink
- Report Inappropriate Content
HI
Use below expressions
Exp1 : Sales :
Sum(Sales)
Exp 2: Accumulatedsales:
If(sum(Sales)<>0, sum( aggr( rangesum( above(Sum(Sales),0,12) ),MonthYear)))
- Mark as New
- Bookmark
- Subscribe
- Mute
- Subscribe to RSS Feed
- Permalink
- Report Inappropriate Content
Here you go !