Unlock a world of possibilities! Login now and discover the exclusive benefits awaiting you.
- Qlik Community
- :
- All Forums
- :
- QlikView App Dev
- :
- Re: Cumul over the FY
- Subscribe to RSS Feed
- Mark Topic as New
- Mark Topic as Read
- Float this Topic for Current User
- Bookmark
- Subscribe
- Mute
- Printer Friendly Page
- Mark as New
- Bookmark
- Subscribe
- Mute
- Subscribe to RSS Feed
- Permalink
- Report Inappropriate Content
Cumul over the FY
Hi guys,
ok, I'm struggling with a cumul..
I need to build a pivot table with a cumul on the Fiscal Year.
I cannot use the Full accumulation because : I'm in a pivot table and it has to restart for each new FY.
I need to get the 2nd column.
| YearMonth | Sum metric | cumul metric |
| 201307 | 1 | 1 |
| 201308 | 12 | 13 |
| 201309 | 34 | 47 |
| 201310 | 54 | 101 |
| 201311 | 65 | 166 |
| 201312 | 33 | 199 |
| 201401 | 23 | 222 |
| 201402 | 56 | 278 |
| 201403 | 87 | 365 |
| 201404 | 6 | 371 |
| 201405 | 45 | 416 |
| 201406 | 23 | 439 |
| 201407 | 15 | 15 |
| 201408 | 45 | 60 |
| 201409 | 38 | 98 |
| 201410 | 56 | 154 |
| 201411 | 8 | 162 |
| 201412 | 35 | 197 |
| 201501 | 87 | 284 |
| 201502 | 67 | 351 |
| 201503 | 5 | 356 |
| 201504 | 65 | 421 |
| 201505 | 67 | 488 |
| 201506 | 89 | 577 |
Please find my app for sample attached.
I tried many things with set analysis and aggr() fonction but I cannot get the exact syntaxe.
Any idea?
Regards,
Eva
- Mark as New
- Bookmark
- Subscribe
- Mute
- Subscribe to RSS Feed
- Permalink
- Report Inappropriate Content
Hi
Use RangeSum()
Find the Expression:
=rangesum(above(sum(Metric),0,rowno()))
Also, see the Attachment.
Regards
Av7eN
- Mark as New
- Bookmark
- Subscribe
- Mute
- Subscribe to RSS Feed
- Permalink
- Report Inappropriate Content
Please see the attached file
And the expression is
=RangeSum(Above(TOTAL Sum(Metric), 0, Rowno(TOTAL)))
- Mark as New
- Bookmark
- Subscribe
- Mute
- Subscribe to RSS Feed
- Permalink
- Report Inappropriate Content
See attached QVW.
=Sum(Metric)+alt(Above(),0)
where B is label for the expression
- Mark as New
- Bookmark
- Subscribe
- Mute
- Subscribe to RSS Feed
- Permalink
- Report Inappropriate Content
Hi Guys,
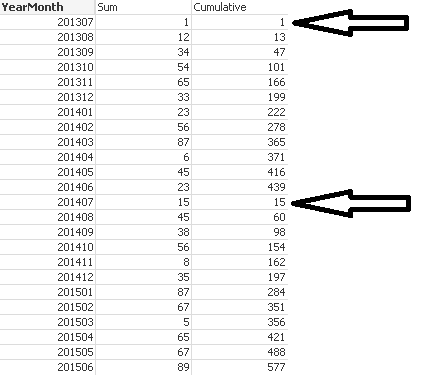
Sorry, I didn't explain properly.. The cumul need to restart at for each new FY.
See the 15 in red below.
| YearMonth | Sum metric | cumul metric |
| 201307 | 1 | 1 |
| 201308 | 12 | 13 |
| 201309 | 34 | 47 |
| 201310 | 54 | 101 |
| 201311 | 65 | 166 |
| 201312 | 33 | 199 |
| 201401 | 23 | 222 |
| 201402 | 56 | 278 |
| 201403 | 87 | 365 |
| 201404 | 6 | 371 |
| 201405 | 45 | 416 |
| 201406 | 23 | 439 |
| 201407 | 15 | 15 |
| 201408 | 45 | 60 |
| 201409 | 38 | 98 |
| 201410 | 56 | 154 |
| 201411 | 8 | 162 |
| 201412 | 35 | 197 |
| 201501 | 87 | 284 |
| 201502 | 67 | 351 |
| 201503 | 5 | 356 |
| 201504 | 65 | 421 |
| 201505 | 67 | 488 |
| 201506 | 89 | 577 |
- Mark as New
- Bookmark
- Subscribe
- Mute
- Subscribe to RSS Feed
- Permalink
- Report Inappropriate Content
Try this Script:
LOAD *,RangeSum(Metric, Peek('CumSum')) AS CumSum INLINE [
FY, YearMonth, Metric
F13 ,201307, 1
F13 ,201308, 12
F13 ,201309, 34
F13 ,201310, 54
F13 ,201311, 65
F13 ,201312, 33
F13 ,201401, 23
F13 ,201402, 56
F13 ,201403, 87
F13 ,201404, 6
F13 ,201405, 45
F13 ,201406, 23
F14 , 201407, 15
F14 , 201408, 45
F14 , 201409, 38
F14 , 201410, 56
F14 , 201411, 8
F14 , 201412, 35
F14 , 201501, 87
F14 , 201502, 67
F14 , 201503, 5
F14 , 201504, 65
F14 , 201505, 67
F14 , 201506, 89
];
Use CumSum in your Chart.
See the Attachment.
Regards
Av7eN
- Mark as New
- Bookmark
- Subscribe
- Mute
- Subscribe to RSS Feed
- Permalink
- Report Inappropriate Content
Hi Eva,
Give your expression name as [Cumulative] and use below expression.
=If(YearStart(Date#(Above(YearMonth), 'YYYYMM'), 0, 7) = YearStart(Date#(YearMonth, 'YYYYMM'), 0, 7), RangeSum(Above([Cumulative]), Sum(Metric)), Sum(Metric))
Hope this helps you.
Regards,
Jagan.
- Mark as New
- Bookmark
- Subscribe
- Mute
- Subscribe to RSS Feed
- Permalink
- Report Inappropriate Content
Hi
Create a new field in the Script:
Right(FY,2) AS NewFY
Use this Script:
ABC:
LOAD *,
Right(FY,2) AS NewFY INLINE [
FY, YearMonth, Metric
F13 ,201307, 1
F13 ,201308, 12
F13 ,201309, 34
F13 ,201310, 54
F13 ,201311, 65
F13 ,201312, 33
F13 ,201401, 23
F13 ,201402, 56
F13 ,201403, 87
F13 ,201404, 6
F13 ,201405, 45
F13 ,201406, 23
F14 , 201407, 15
F14 , 201408, 45
F14 , 201409, 38
F14 , 201410, 56
F14 , 201411, 8
F14 , 201412, 35
F14 , 201501, 87
F14 , 201502, 67
F14 , 201503, 5
F14 , 201504, 65
F14 , 201505, 67
F14 , 201506, 89
];
After Reloading the Script, Use this:
Dimension: YearMonth
Expression: =AGGR(rangesum(above(sum(Metric),0,rowno())),NewFY,YearMonth)
The Final Result:
See the Attachment.
Regards
Av7eN