Unlock a world of possibilities! Login now and discover the exclusive benefits awaiting you.
- Qlik Community
- :
- All Forums
- :
- QlikView App Dev
- :
- Re: Cumulative Incidents resolved within SLA
- Subscribe to RSS Feed
- Mark Topic as New
- Mark Topic as Read
- Float this Topic for Current User
- Bookmark
- Subscribe
- Mute
- Printer Friendly Page
- Mark as New
- Bookmark
- Subscribe
- Mute
- Subscribe to RSS Feed
- Permalink
- Report Inappropriate Content
Cumulative Incidents resolved within SLA
Hi,
I have a new challenge regarding how to create a cumulative incidents chart.
Is a way to do this in set analysis? I have attached the excel files where you can see in the Cumulative Within SLA Tab how I do the calculation.
For ex:
Oct-17 I do sum(Within SLA - Yes) / total which is 46/73 = 63.01%
Nov-17 I do sum(OCT-17 + Nov -17) / SUM(OCT-17 +NOV-17) which is (46+40)/(73+76) = 52.63%
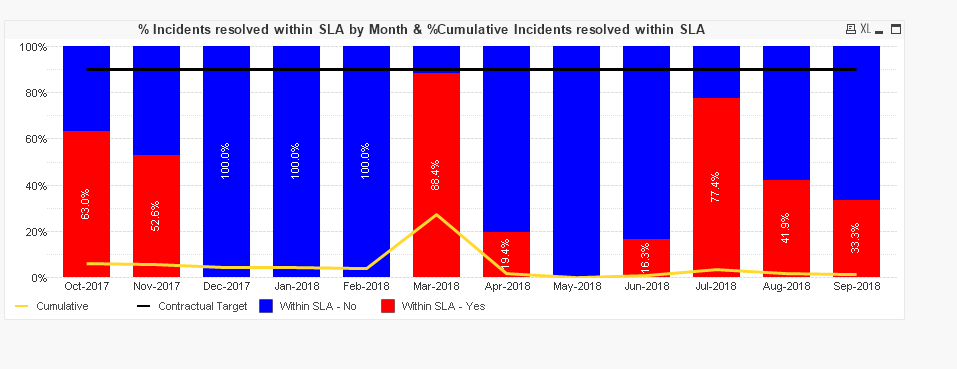
| Month | Within SLA - Yes | Within SLA - No | Total | Cumulative Within SLA |
| Oct-17 | 46 | 27 | 73 | 63.01% |
| Nov-17 | 40 | 36 | 76 | 52.63% |
| Dec-17 | 31 | 0 | 31 | 100.00% |
| Jan-18 | 31 | 0 | 31 | 100.00% |
| Feb-18 | 28 | 0 | 28 | 100.00% |
| Mar-18 | 199 | 26 | 225 | 88.44% |
| Apr-18 | 14 | 58 | 72 | 19.44% |
| May-18 | 0 | 62 | 62 | 0.00% |
| Jun-18 | 7 | 36 | 43 | 16.28% |
| Jul-18 | 24 | 7 | 31 | 77.42% |
| Aug-18 | 13 | 18 | 31 | 41.94% |
| Sep-18 | 10 | 20 | 30 | 33.33% |
Thanks
Accepted Solutions
- Mark as New
- Bookmark
- Subscribe
- Mute
- Subscribe to RSS Feed
- Permalink
- Report Inappropriate Content
Your Cumulative Within SLA column isn't cumulative, it's just calculated on row level.
That said, take a look at the following:

It's made in Qlik Sense, but the measure should work for QV as well.
Measure:
RangeSum(Above(Sum([Within SLA - Yes]),0,RowNo())) / RangeSum(Above(Sum(Total),0,RowNo()))
- Mark as New
- Bookmark
- Subscribe
- Mute
- Subscribe to RSS Feed
- Permalink
- Report Inappropriate Content
Your Cumulative Within SLA column isn't cumulative, it's just calculated on row level.
That said, take a look at the following:
It's made in Qlik Sense, but the measure should work for QV as well.
Measure:
RangeSum(Above(Sum([Within SLA - Yes]),0,RowNo())) / RangeSum(Above(Sum(Total),0,RowNo()))
- Mark as New
- Bookmark
- Subscribe
- Mute
- Subscribe to RSS Feed
- Permalink
- Report Inappropriate Content
what is your expected output?
As you want like above said by Tim