Unlock a world of possibilities! Login now and discover the exclusive benefits awaiting you.
- Qlik Community
- :
- All Forums
- :
- QlikView App Dev
- :
- Cumulative Sum - Dimension Problem
- Subscribe to RSS Feed
- Mark Topic as New
- Mark Topic as Read
- Float this Topic for Current User
- Bookmark
- Subscribe
- Mute
- Printer Friendly Page
- Mark as New
- Bookmark
- Subscribe
- Mute
- Subscribe to RSS Feed
- Permalink
- Report Inappropriate Content
Cumulative Sum - Dimension Problem
Hi, friends from QlikView community. I'm a newbie here, but I trained day or two with cumulative sums.
I have a dataset with 6 dimensions:
- Year (Rok): 2014, 2013,02012 ...
- Month (Obdobie): 1.12.2014, 1.11.2014, 1.10.2014 ....
- Series (Seria): Plan / Reality (Uctovnictvo)
- Code (Kód): AZZZ, B07VRA, D01TSC ... - types of incomes and costs
- Phase (Faza): B01REAL, B02MIMOREAL .. - codes of Phases, in which incomes/ costs occur
- Amount (Ciastka) in EUR
I designed a dashboard (sheet) with a cumulative chart of a calculated expression (D01TSC-AZZZ)/AZZZ.
Expression is here:
((Rangesum(Above(total Sum({$<[Kód]={D01TSČ}>}Čiastka),0,RowNo(total))))
+(Rangesum(Above(total Sum({$<[Kód]={AZZZ}>}Čiastka),0,RowNo(total)))))/
(-1*(Rangesum(Above(total Sum({$<[Kód]={AZZZ}>}Čiastka),0,RowNo(total)))))
Everything works fine (I'm very proud of me :-)), but only when I select only one of the crucial dimension Series.
If I select both (Plan AND Reality), data are not identic with previous situation.
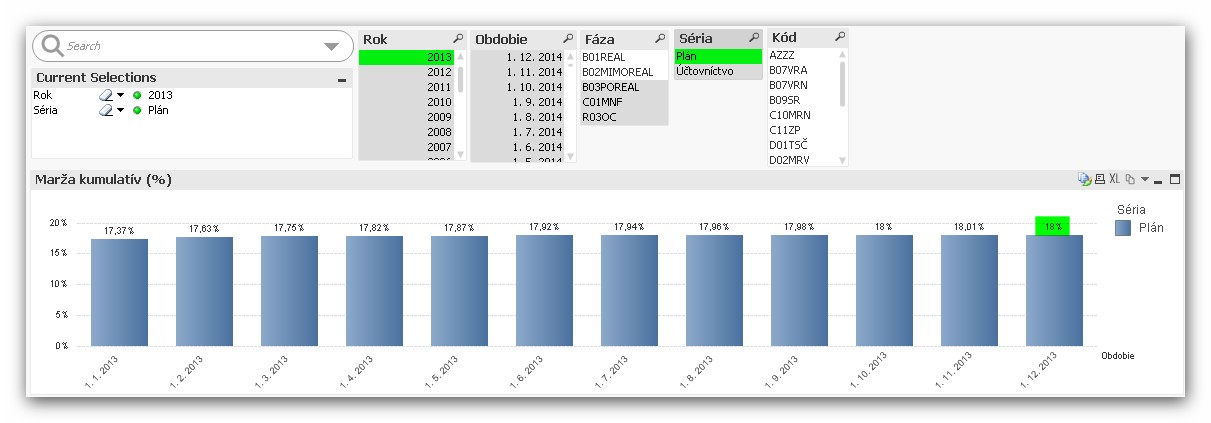
Situation Nr.1: Series = Plan, Cumulative result for Dec 2013 = 18,00% - OK
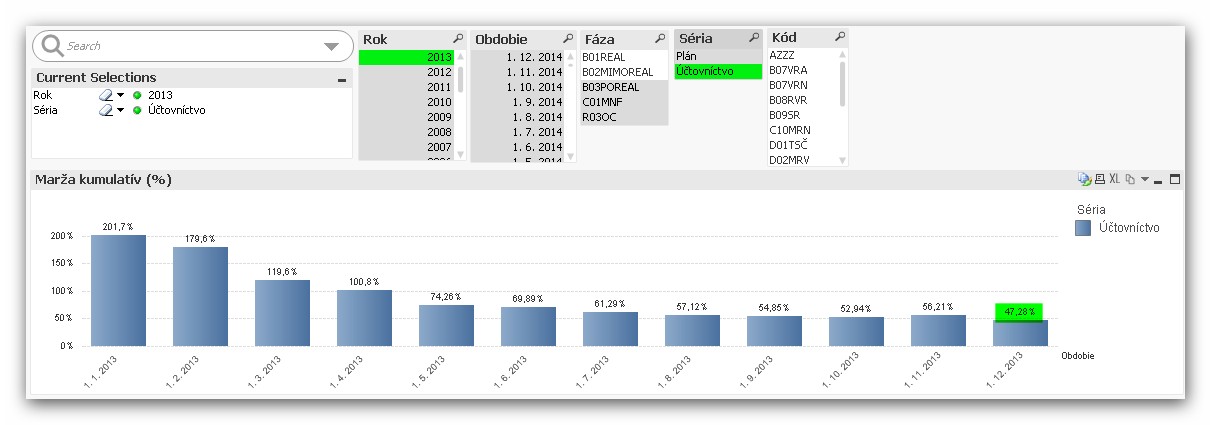
Situation Nr.2: Series = Uctovnictvo, Cumulative result for Dec 2013 = 47,28% - OK
Situation Nr.3: Series = Plan AND Uctovnictvo, Cumulative results for Dec 2013 differ from above
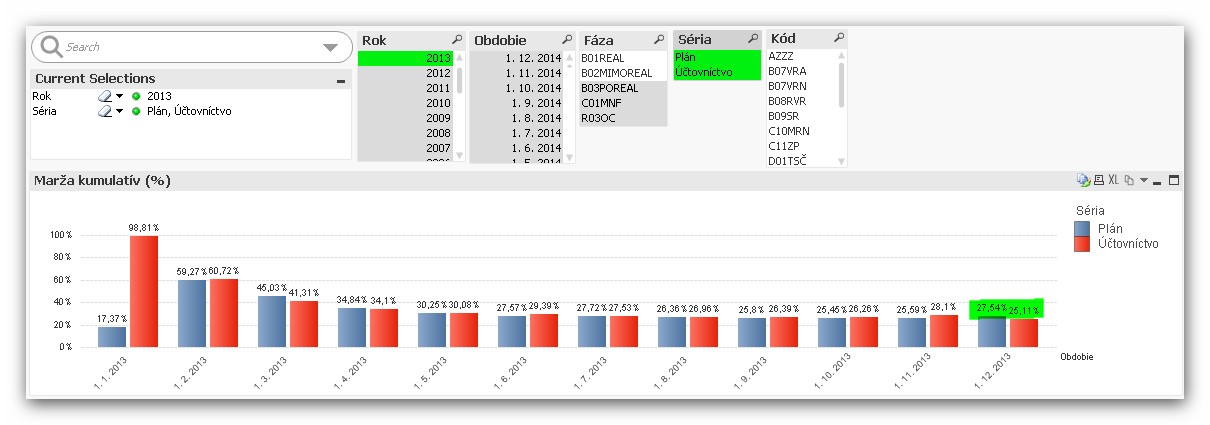
The problem causes something wrong in manipulating dimensions in the expression, but I can't find it out 😞
Can U help me, pls. ?
Thanks in advance.
Duski