Unlock a world of possibilities! Login now and discover the exclusive benefits awaiting you.
- Qlik Community
- :
- All Forums
- :
- QlikView App Dev
- :
- Cumulative chart by start date, allowing me to sho...
- Subscribe to RSS Feed
- Mark Topic as New
- Mark Topic as Read
- Float this Topic for Current User
- Bookmark
- Subscribe
- Mute
- Printer Friendly Page
- Mark as New
- Bookmark
- Subscribe
- Mute
- Subscribe to RSS Feed
- Permalink
- Report Inappropriate Content
Cumulative chart by start date, allowing me to show all previous contributors
Hi all,
Thank you in advance for any assistance I receive - I have been working pretty solidly for years in Excel but only recently ventured into qlikview...
I have a problem which relates to project planning and delivery, where I have data structured so that
- A line is defined as a workstream
- Each workstream has a defined start date, after which cost flows across a number of months (each a different column in the dataset) and then totalled in a total column
- Each workstream is at a different level of certainty, so that if you look at a cumulative view of all the workstreams with a given start date, the chart of total (i.e.taken as a sum of the total column, not any of the individual months) workstream cost is represented against it's start month as below
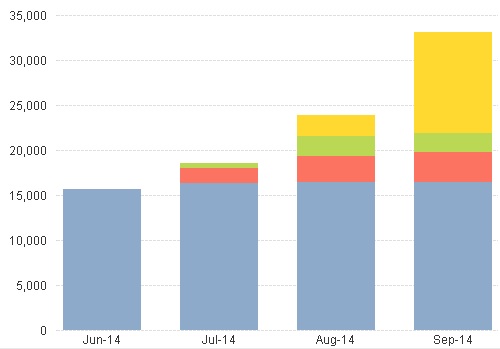
(i.e. June has everything committed, and the total cost of all workstreams starting in June is slightly more than 15k. There is then slightly more committed in July, but with other workstreams starting that are not yet committed)
The graph above was drawn from a dataset I had initially made in Excel specifically for this purpose (which basically SUMIFS the data by category if the start month is less than the month shown), but I now would like to try and do it in qlikview using the main dataset.
I would like to:
- be able to select Jun-Sep, May-Jul etc. without impacting the figures that are shown (i.e. June doesn't rely on April and May being selected to have the same ~15k value as it has now)
- select a part of the chart and actually see the items that contribute to it in a list box (i.e. click on the red part in September, and see the July, August and September items that contribute to it)
The idea is then that you can see that your selection indicates the items to which work needs to be done to turn them blue.
I hope that this makes sense - if you have any questions then do feel free to ask. I should make you aware that I am working on the personal (i.e. unlicensed for sharing) version of qlikview and the raw data is confidential so I am not able to share directly, but I would greatly appreciate the help if somebody knows the approach that I should be taking with this.
Many thanks