Unlock a world of possibilities! Login now and discover the exclusive benefits awaiting you.
- Qlik Community
- :
- All Forums
- :
- QlikView App Dev
- :
- Cumulative sum(sales)
- Subscribe to RSS Feed
- Mark Topic as New
- Mark Topic as Read
- Float this Topic for Current User
- Bookmark
- Subscribe
- Mute
- Printer Friendly Page
- Mark as New
- Bookmark
- Subscribe
- Mute
- Subscribe to RSS Feed
- Permalink
- Report Inappropriate Content
Cumulative sum(sales)
Hi Team - I need to have the cumulative sum(sales) in descending order and their respective %. Attached is the sample data and qvw Attached.. Plz Help !
- « Previous Replies
-
- 1
- 2
- Next Replies »
- Mark as New
- Bookmark
- Subscribe
- Mute
- Subscribe to RSS Feed
- Permalink
- Report Inappropriate Content
Something like this?
- Mark as New
- Bookmark
- Subscribe
- Mute
- Subscribe to RSS Feed
- Permalink
- Report Inappropriate Content
My bad, try this instead
Script
LOAD Product,
Location,
Sales,
AutoNumber(Product&Location) as Key
FROM
TestData.xlsx
(ooxml, embedded labels);
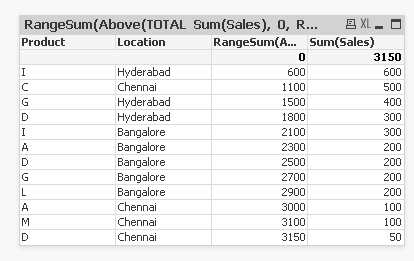
Use Key as a dimension, but hide it on the presentation tab. Sort Key by Sum(Sales) in descending order to get this
- Mark as New
- Bookmark
- Subscribe
- Mute
- Subscribe to RSS Feed
- Permalink
- Report Inappropriate Content
Hi Sunny - I tried above... Performance of my DB is poor.. After adding the "RangeSum(Above(TOTAL Sum(Sales), 0, RowNo(TOTAL)))" , am just stuck with the chart to get Refreshed.. It shows below Refresh icon and it is still at this screen for almost 15 mins... I have around 1M rows.. Any other better idea to improve performance?
- Mark as New
- Bookmark
- Subscribe
- Mute
- Subscribe to RSS Feed
- Permalink
- Report Inappropriate Content
The only other way I can think of is to do this in the script... but then you loose the ability to change numbers based on selection on the front end
- Mark as New
- Bookmark
- Subscribe
- Mute
- Subscribe to RSS Feed
- Permalink
- Report Inappropriate Content
ohhhh!!!! 
- Mark as New
- Bookmark
- Subscribe
- Mute
- Subscribe to RSS Feed
- Permalink
- Report Inappropriate Content
Hello Sunny. I'll be really glad, if you help me with the same case.) I have Table containing two column "date" and "sale".and I try to find out how i can get cumulative sum in each month i have. I need table like this. Please, help me =(:
| Date | sale | cumulative |
| 01.10.2017 | 10 824 050 | 10 824 050 |
| 02.10.2017 | 8 267 376 | 19 091 426 |
| 03.10.2017 | 8 799 371 | 27 890 797 |
| 04.10.2017 | 8 940 368 | 36 831 165 |
| 05.10.2017 | 9 699 608 | 46 530 773 |
| 06.10.2017 | 10 797 779 | 57 328 552 |
| 07.10.2017 | 12 949 544 | 70 278 096 |
| 08.10.2017 | 10 155 186 | 80 433 282 |
| … | … | … |
| 29.10.2017 | 10 560 744 | 302 130 085 |
| 30.10.2017 | 8 323 429 | 310 453 514 |
| 31.10.2017 | 8 834 970 | 319 288 484 |
| 01.11.2017 | 8 892 937 | 8 892 937 |
| 02.11.2017 | 9 691 612 | 18 584 550 |
| 03.11.2017 | 12 477 173 | 31 061 722 |
| 04.11.2017 | 14 011 628 | 45 073 350 |
| 05.11.2017 | 11 097 012 | 56 170 362 |
| 06.11.2017 | 9 482 524 | 65 652 887 |
| 07.11.2017 | 7 850 063 | 73 502 950 |
| 08.11.2017 | 8 372 517 | 81 875 467 |
- Mark as New
- Bookmark
- Subscribe
- Mute
- Subscribe to RSS Feed
- Permalink
- Report Inappropriate Content
You need this in the script or front end of the application?
- Mark as New
- Bookmark
- Subscribe
- Mute
- Subscribe to RSS Feed
- Permalink
- Report Inappropriate Content
Will be awesome in front end of the application, if you dont mind.
- Mark as New
- Bookmark
- Subscribe
- Mute
- Subscribe to RSS Feed
- Permalink
- Report Inappropriate Content
I have added 3 expression to show how it can be done
1) =RangeSum(Above(Sum(Sale), 0, RowNo()))
2) =Aggr(RangeSum(Above(Sum(Sale), 0, RowNo())), MonthYear, Date)
3) =Aggr(RangeSum(Above(Sum(Sale), 0, RowNo())), MonthYear, (Date, (NUMERIC)))
So, the expression 1 is dependent on your chart sorting which needs to be first by MonthYear and second by date in ascending order
expression 2 is dependent on sort in the script... for this to work, date needs to be sorted in ascending order within the script. In this case it was, so it worked.
expression 3 is only doable in QlikView 12 or above as it was introduced after with QV 12.... you can read more about it here The sortable Aggr function is finally here!, but the idea is that you can specify the sorting with aggr function and not just take the sorting from the load order.
HTH
Best,
Sunny
- « Previous Replies
-
- 1
- 2
- Next Replies »