Unlock a world of possibilities! Login now and discover the exclusive benefits awaiting you.
- Qlik Community
- :
- All Forums
- :
- QlikView App Dev
- :
- Re: Current week
- Subscribe to RSS Feed
- Mark Topic as New
- Mark Topic as Read
- Float this Topic for Current User
- Bookmark
- Subscribe
- Mute
- Printer Friendly Page
- Mark as New
- Bookmark
- Subscribe
- Mute
- Subscribe to RSS Feed
- Permalink
- Report Inappropriate Content
Current week
Hi all,
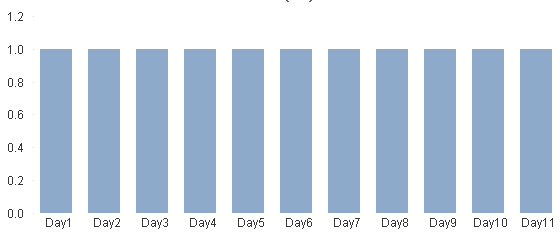
I want to display the dimension as current week like below
My date field is Tran_Date
Day1
Day2
Day3
Day4
Day5
Day6 this is current week except sunday
how can I write the calculation condition?
- Mark as New
- Bookmark
- Subscribe
- Mute
- Subscribe to RSS Feed
- Permalink
- Report Inappropriate Content
Not sure sure your request - But, You can think something like below
WeekDay(DateField) as WeekDay,
Week(DateField) as Week
And measure
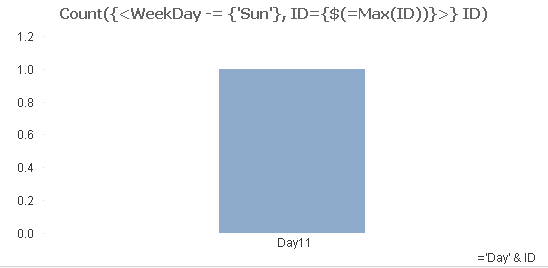
Count({<WeekDay -= {'Sun'}, Week = {$(=Max(Week))}>} ID)
- Mark as New
- Bookmark
- Subscribe
- Mute
- Subscribe to RSS Feed
- Permalink
- Report Inappropriate Content
requirement is
I need to show the chart weekdays count(id) with dimension values like day1 to day6
- Mark as New
- Bookmark
- Subscribe
- Mute
- Subscribe to RSS Feed
- Permalink
- Report Inappropriate Content
Can you provide data set to test?
- Mark as New
- Bookmark
- Subscribe
- Mute
- Subscribe to RSS Feed
- Permalink
- Report Inappropriate Content
Hi
my data look like below
| Tran_Date | ID |
| 1/6/2018 | 1 |
| 2/6/2018 | 2 |
| 3/6/2018 | 3 |
| 4/6/2018 | 4 |
| 5/6/2018 | 5 |
| 6/6/2018 | 6 |
| 7/6/2018 | 7 |
| 8/6/2018 | 8 |
| 9/6/2018 | 9 |
| 10/6/2018 | 10 |
| 11/6/2018 | 11 |
- Mark as New
- Bookmark
- Subscribe
- Mute
- Subscribe to RSS Feed
- Permalink
- Report Inappropriate Content
This is not you are looking or am i missing something?
OR
- Mark as New
- Bookmark
- Subscribe
- Mute
- Subscribe to RSS Feed
- Permalink
- Report Inappropriate Content
can you attach the app ?
- Mark as New
- Bookmark
- Subscribe
- Mute
- Subscribe to RSS Feed
- Permalink
- Report Inappropriate Content
Not sure what App you are expecting? That is straight forward, Anyway PFA
- Mark as New
- Bookmark
- Subscribe
- Mute
- Subscribe to RSS Feed
- Permalink
- Report Inappropriate Content
but this is not am expecting 
the result should be like
input:
LOAD *,WeekDay(Tran_Date) as WeekDay Inline [
Tran_Date, ID
4/6/2018, 4 ----
4/6/2018, 10 ----- here 4th jun 2018 Monday in chart Day1 -count 2 result like that all [excluding sunday]
5/6/2018, 5
5/6/2018, 12
6/6/2018, 6
7/6/2018, 7
8/6/2018, 8
8/6/2018, 16
];
output:
bar chart:
dim: values
Day1 Means Mon till Day6 means sat
Day1 Day2 Day3 Day4 Day5 Day6 each day count has to show on bar.
- Mark as New
- Bookmark
- Subscribe
- Mute
- Subscribe to RSS Feed
- Permalink
- Report Inappropriate Content
Not clear  Can you share real data and expected output to test? That will en count you.
- Mark as New
- Bookmark
- Subscribe
- Mute
- Subscribe to RSS Feed
- Permalink
- Report Inappropriate Content
in attached sample expected output drawn.
input value I don't have dayname column I want to create it from tran_date field