Unlock a world of possibilities! Login now and discover the exclusive benefits awaiting you.
- Qlik Community
- :
- All Forums
- :
- QlikView App Dev
- :
- Custom Sorting
- Subscribe to RSS Feed
- Mark Topic as New
- Mark Topic as Read
- Float this Topic for Current User
- Bookmark
- Subscribe
- Mute
- Printer Friendly Page
- Mark as New
- Bookmark
- Subscribe
- Mute
- Subscribe to RSS Feed
- Permalink
- Report Inappropriate Content
Custom Sorting
Hi,
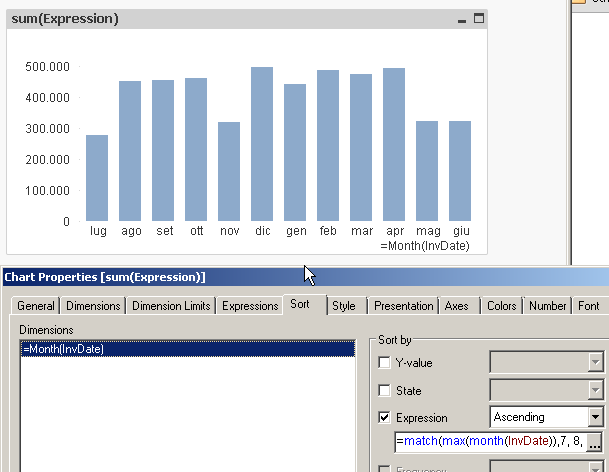
I have month on x-axis and two other metrics for comparison 2013-2014 and 2014-2015. I am trying to create custom sort on x-axis as per Australian calendar which starts from July to June.
I am comparing the Sales Value data here is 2013-2014 and 2014-2015.
But not able to implement custom sorting. Pls let me know.
Thanks,
- « Previous Replies
-
- 1
- 2
- Next Replies »
- Mark as New
- Bookmark
- Subscribe
- Mute
- Subscribe to RSS Feed
- Permalink
- Report Inappropriate Content
I am looking at the Australian Calendar which FY will starts from July to June.
Thanks,
- Mark as New
- Bookmark
- Subscribe
- Mute
- Subscribe to RSS Feed
- Permalink
- Report Inappropriate Content
Use something like this:
Load
NewDate,
'Q'&Ceil(Num(Month(AddMonths(NewDate,-6)))/3) AS [Fiscal Quarter],
Month(NewDate) AS [Fiscal Month],
yearname(NewDate,0,7) AS [Fiscal Year]
FROm Table.qvd;
The above script will create your Fiscal Year starting from July to June.
Kindly, change NewDate with your Table FieldName.
Also, see the Attachment.
Regards
Aviral Nag
- Mark as New
- Bookmark
- Subscribe
- Mute
- Subscribe to RSS Feed
- Permalink
- Report Inappropriate Content
try with sort by expression
=match(max(month(InvDate)),7, 8, 9, 10, 11, 12, 1, 2, 3, 4, 5, 6)
- Mark as New
- Bookmark
- Subscribe
- Mute
- Subscribe to RSS Feed
- Permalink
- Report Inappropriate Content
Hello Madu, Here's a quick app that will generate multiple years of offset calendars, just assign the 3 parameters:
-Start year
-No of years to generate
-the AddMonths shift
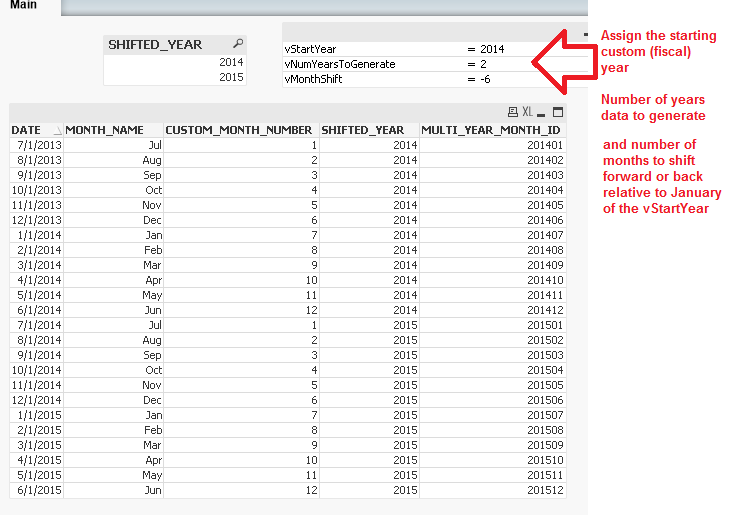
A combined field of the custom (or calendar) year concatenated with the month number should be enough to enforce chronological sort - i.e. Max(MULTI_YEAR_MONTH_ID). (an alternative using the integer value of the month start of each entry would be fine as well).
If your chart axis is only rendering 12 months at a time, but the data holds more than one year of info you'll have multiple years of data piling up in each MONTH dimension (Jan 2014 and Jan 2015 data both rendering under 'Jan'). If you wanted to extend the x-axis to span multiple years, you now have a field like MULTI_YEAR_MONTH_ID to make sure everyone stays in sequence.
Using a Dual() encapsulated value should work fine for sort expressions, but if you intend to eventually involve that field in comparative set-analysis, Dual() encapsulated data can present issues when used in conjunction with set-analysis.
You can test this on your own, but if you take a set-analysis selection that bookends some ranges, see if you get the same results with a purely numeric encoded field vs. a dual().
This expression will work while MULTI_YEAR_MONTH_ID is a purely numeric field:
Sum( {<MULTI_YEAR_MONTH_ID={">= 201501 <= 201504"}>} AMOUNT)
Then converting the entries in MULTI_YEAR_MONTH_ID to encapsulate Dual() using entries like:
LOAD Dual('Jan 2015',201501) AS MULTI_YEAR_MONTH_ID AUTOGENERATE(1);
LOAD Dual('Apr 2015',201504) AS MULTI_YEAR_MONT_ID AUTOGENERATE(1);
If I try the above expression again after converting MULTI_YEAR_MONTH_ID to Dual(), the set-analysis seems to want to evaluate the textual portion of the dual() data type and doesn't pick up on the numeric values (even if you use some explicit data type reference like Sum({<MULTI_YEAR_MONTH_ID={">= $(=Num(Min(MULTI_YEAR_MONTH_ID)))"}>} AMOUNT), and now you can see the set-analysis syntax burgeoning).
That's why even though it seems convenient to combine some date fields in dual, why they may have been split off. Date range Set-analysis works most consistent, and the syntax remains minimal, if it is constructed around purely numeric fields and you don't get entangled in the mess of needing to craft expressions that convert back and forth between format strings and their underlying numeric representations.
- « Previous Replies
-
- 1
- 2
- Next Replies »