Unlock a world of possibilities! Login now and discover the exclusive benefits awaiting you.
- Qlik Community
- :
- All Forums
- :
- QlikView App Dev
- :
- Re: Daily sum based on a period
- Subscribe to RSS Feed
- Mark Topic as New
- Mark Topic as Read
- Float this Topic for Current User
- Bookmark
- Subscribe
- Mute
- Printer Friendly Page
- Mark as New
- Bookmark
- Subscribe
- Mute
- Subscribe to RSS Feed
- Permalink
- Report Inappropriate Content
Daily sum based on a period
Hi folks,
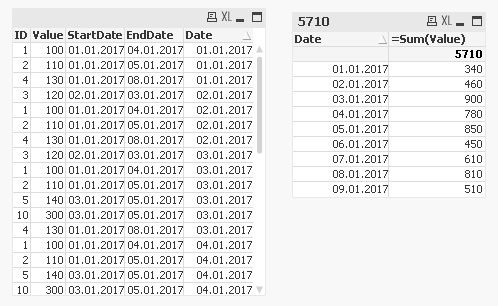
I got to calculate daily Sum of Value based on IDs available on each date. Basically initial table looks like:
| ID | Value | StartDate | EndDate |
|---|---|---|---|
| 1 | 100 | 01.01.2017 | 04.01.2017 |
| 2 | 110 | 01.01.2017 | 05.01.2017 |
| 3 | 120 | 02.01.2017 | 03.01.2017 |
| 4 | 130 | 01.01.2017 | 08.01.2017 |
| 5 | 140 | 03.01.2017 | 05.01.2017 |
| 6 | 150 | 06.01.2017 | 09.01.2017 |
| 7 | 160 | 07.01.2017 | 09.01.2017 |
| 8 | 170 | 05.01.2017 | 08.01.2017 |
| 9 | 200 | 08.01.2017 | 09.01.2017 |
| 10 | 300 | 03.01.2017 | 05.01.2017 |
And as the outcome I need to get:
| Date | Value (Date>=StartDate and Date<= EndDate) |
|---|---|
| 01.01.2017 | 340 (100+110+130) |
| 02.01.2017 | 460 |
| 03.01.2017 | 900 |
| 04.01.2017 | 780 |
| 05.01.2017 | 850 |
| 06.01.2017 | 450 |
| 07.01.2017 | 610 |
| 08.01.2017 | 810 |
| 09.01.2017 | 510 |
Is it possible to do such calculation in visualization (not in the script?), and if not how can I incorporate this into the model (so when I choose a certain date, associated IDs which constitute the Value sum are selected) ?
Would appreciate any help 
- « Previous Replies
-
- 1
- 2
- Next Replies »
Accepted Solutions
- Mark as New
- Bookmark
- Subscribe
- Mute
- Subscribe to RSS Feed
- Permalink
- Report Inappropriate Content
May be using While or Interval Match.....
While based solution
Table:
LOAD *,
Date(StartDate + IterNo() - 1) as Date
While StartDate + IterNo() - 1 <= EndDate;
LOAD * INLINE [
ID, Value, StartDate, EndDate
1, 100, 01.01.2017, 04.01.2017
2, 110, 01.01.2017, 05.01.2017
3, 120, 02.01.2017, 03.01.2017
4, 130, 01.01.2017, 08.01.2017
5, 140, 03.01.2017, 05.01.2017
6, 150, 06.01.2017, 09.01.2017
7, 160, 07.01.2017, 09.01.2017
8, 170, 05.01.2017, 08.01.2017
9, 200, 08.01.2017, 09.01.2017
10, 300, 03.01.2017, 05.01.2017
];
- Mark as New
- Bookmark
- Subscribe
- Mute
- Subscribe to RSS Feed
- Permalink
- Report Inappropriate Content
As per my experience it's not done in Visualization.
- Mark as New
- Bookmark
- Subscribe
- Mute
- Subscribe to RSS Feed
- Permalink
- Report Inappropriate Content
Yeah, so I think,
but I cant quite find a way to do it in the script either.
I've tried data island (like this post describes Cumulative distinct customer | Qlik Community) and it seems to work, but it's impossible to account for selections in this case
- Mark as New
- Bookmark
- Subscribe
- Mute
- Subscribe to RSS Feed
- Permalink
- Report Inappropriate Content
I don't think so it is possible in front end.
but in back end you can achieve it using intervalmatch().
Regards,
Prashant Sangle
Please appreciate our Qlik community members by giving Kudos for sharing their time for your query. If your query is answered, please mark the topic as resolved 🙂
- Mark as New
- Bookmark
- Subscribe
- Mute
- Subscribe to RSS Feed
- Permalink
- Report Inappropriate Content
May be using While or Interval Match.....
While based solution
Table:
LOAD *,
Date(StartDate + IterNo() - 1) as Date
While StartDate + IterNo() - 1 <= EndDate;
LOAD * INLINE [
ID, Value, StartDate, EndDate
1, 100, 01.01.2017, 04.01.2017
2, 110, 01.01.2017, 05.01.2017
3, 120, 02.01.2017, 03.01.2017
4, 130, 01.01.2017, 08.01.2017
5, 140, 03.01.2017, 05.01.2017
6, 150, 06.01.2017, 09.01.2017
7, 160, 07.01.2017, 09.01.2017
8, 170, 05.01.2017, 08.01.2017
9, 200, 08.01.2017, 09.01.2017
10, 300, 03.01.2017, 05.01.2017
];
- Mark as New
- Bookmark
- Subscribe
- Mute
- Subscribe to RSS Feed
- Permalink
- Report Inappropriate Content
May be typo error
While StartDate + IterNo() - 1 <= EndDate;
- Mark as New
- Bookmark
- Subscribe
- Mute
- Subscribe to RSS Feed
- Permalink
- Report Inappropriate Content
How you get it 900 for 3rd Date ??
- Mark as New
- Bookmark
- Subscribe
- Mute
- Subscribe to RSS Feed
- Permalink
- Report Inappropriate Content
Hahahaha yes, thanks for pointing it out Anil
- Mark as New
- Bookmark
- Subscribe
- Mute
- Subscribe to RSS Feed
- Permalink
- Report Inappropriate Content
Made the correction above
- Mark as New
- Bookmark
- Subscribe
- Mute
- Subscribe to RSS Feed
- Permalink
- Report Inappropriate Content
Thank you much, intervalmatch worked indeed
- « Previous Replies
-
- 1
- 2
- Next Replies »