Unlock a world of possibilities! Login now and discover the exclusive benefits awaiting you.
- Qlik Community
- :
- All Forums
- :
- QlikView App Dev
- :
- Dashboard to create in Qlikview
- Subscribe to RSS Feed
- Mark Topic as New
- Mark Topic as Read
- Float this Topic for Current User
- Bookmark
- Subscribe
- Mute
- Printer Friendly Page
- Mark as New
- Bookmark
- Subscribe
- Mute
- Subscribe to RSS Feed
- Permalink
- Report Inappropriate Content
Dashboard to create in Qlikview
Hi All,
I am new to Qlikview. I want to do some applications over this. Now my step is to create dashboard as below attached file. Am connecting SAP MS SQL server for database. Can anyone tell me how to do this type dashboard?
Waiting for your vaid reply. Thanks in advance 
Regards
Glory
- « Previous Replies
-
- 1
- 2
- Next Replies »
- Mark as New
- Bookmark
- Subscribe
- Mute
- Subscribe to RSS Feed
- Permalink
- Report Inappropriate Content
Hi
Can you tell me what are all steps u have done so far. so that i can able to on my side
Regards
Glory
- Mark as New
- Bookmark
- Subscribe
- Mute
- Subscribe to RSS Feed
- Permalink
- Report Inappropriate Content
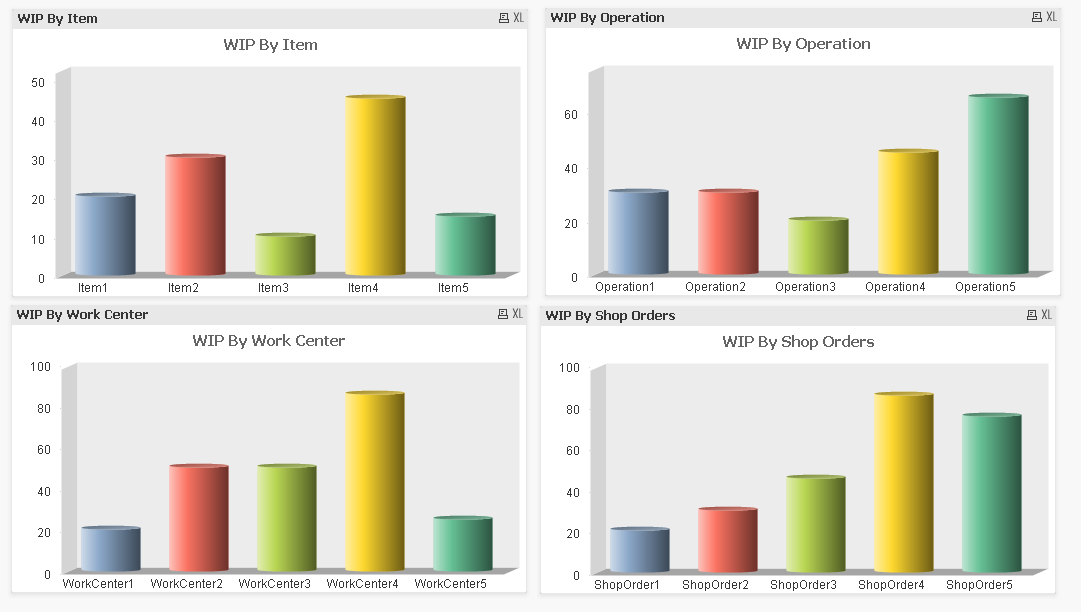
this is the script that i have used.
ByItems:
LOAD * INLINE [
Items, QuantityI
Item1, 20
Item2, 30
Item3, 10
Item4, 45
Item5, 15
];
ByOperation:
LOAD * INLINE [
Operations, QuantityO
Operation1, 30
Operation2, 30
Operation3, 20
Operation4, 45
Operation5, 65
];
ByWorkCenter:
LOAD * INLINE [
WorkCenters, QuantityWC
WorkCenter1, 20
WorkCenter2, 50
WorkCenter3, 50
WorkCenter4, 85
WorkCenter5, 25
];
ByShopOrder:
LOAD * INLINE [
ShopOrders, QuantitySO
ShopOrder1, 20
ShopOrder2, 30
ShopOrder3, 45
ShopOrder4, 85
ShopOrder5, 75
];
and the charts look like the image below...
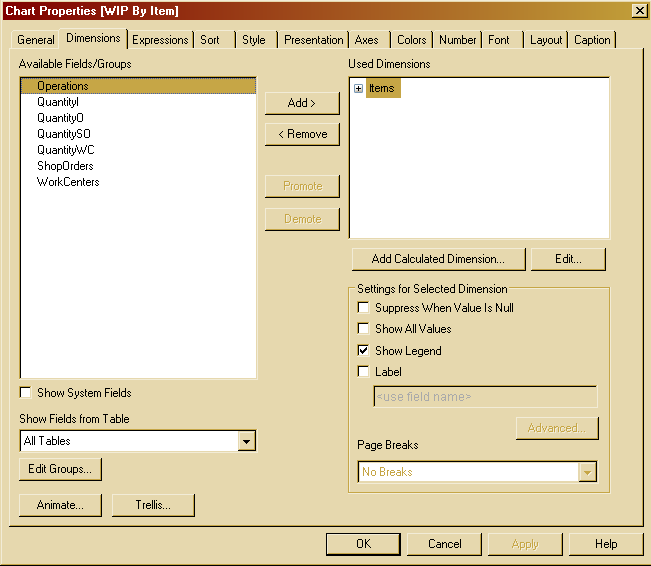
The chart dimension...
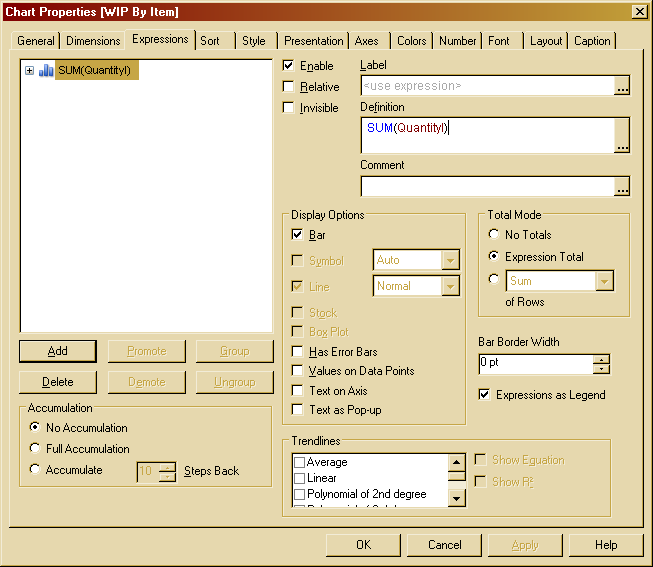
the chart expression
or you can follow th einstructions on the link that i had provided to you earlier.. on creating your first dashboard..
hope that helps...
thanks,
Aadil
- Mark as New
- Bookmark
- Subscribe
- Mute
- Subscribe to RSS Feed
- Permalink
- Report Inappropriate Content
Thanks for ur valid reply aadil. but when i load script in edit script nothing is showing in display!?? Where i went wrong?
- Mark as New
- Bookmark
- Subscribe
- Mute
- Subscribe to RSS Feed
- Permalink
- Report Inappropriate Content
Hi Aadil,
Just tell me what are all fields you have selected from database for WIP?
- Mark as New
- Bookmark
- Subscribe
- Mute
- Subscribe to RSS Feed
- Permalink
- Report Inappropriate Content
Hi Aadil
- Mark as New
- Bookmark
- Subscribe
- Mute
- Subscribe to RSS Feed
- Permalink
- Report Inappropriate Content
You can follow the below steps to create the chart.
Use the script that i have provided to you.
Reload the document.
Now on the blank canvas, right click and select New Sheet object and then select Chart.
now you will have a lot of charting options.. and by default the Bar Chart will be selected
just click the next button.. no need to make any changes on the dialog box
click on the field name Items and then click Add
this will add the dimension
now click on the next
write the expression SUM(QuantityI)
now you can click on the next button.. and go thorugh till finish.. no need to make any other changes..
this will plot a basic chart...
- Mark as New
- Bookmark
- Subscribe
- Mute
- Subscribe to RSS Feed
- Permalink
- Report Inappropriate Content
Hi Aadil
Thanks for your time. I need to know what are all the fields to be used in WIP
- « Previous Replies
-
- 1
- 2
- Next Replies »