Unlock a world of possibilities! Login now and discover the exclusive benefits awaiting you.
- Qlik Community
- :
- All Forums
- :
- QlikView App Dev
- :
- Data Island calculation
- Subscribe to RSS Feed
- Mark Topic as New
- Mark Topic as Read
- Float this Topic for Current User
- Bookmark
- Subscribe
- Mute
- Printer Friendly Page
- Mark as New
- Bookmark
- Subscribe
- Mute
- Subscribe to RSS Feed
- Permalink
- Report Inappropriate Content
Data Island calculation
I'm looking for the appropriate formula to include in a chart expression.
Here is an example set of data. I have 3 data islands.
Data Island 1
Parts Price
PartA 10
PartB 20
PartC 30
Data Island 2
Parts Currency
PartA USD
PartB USD
PartC EURO
Data Island 3
Currency Rate
EURO 1.09
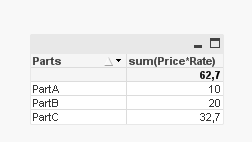
Island 2 identifies the currency in which Island 1's prices are entered. I would like to create a table chart that lists prices by part all in USD. Therefore, if the parts currency is already USD then just show the price but if the Currency is Euro then it needs to take the price and multiply by the rate. The chart table should result in:
Parts Price
PartA 10
PartB 20
PartC 32.70
- Mark as New
- Bookmark
- Subscribe
- Mute
- Subscribe to RSS Feed
- Permalink
- Report Inappropriate Content
Hi
Check the attached file, You can customize to yours...
Thanks
Satish
- Mark as New
- Bookmark
- Subscribe
- Mute
- Subscribe to RSS Feed
- Permalink
- Report Inappropriate Content
Hello Mark,
One solution is to use the applymap function in Script.
See the attach file.
Hope this helps.
- Mark as New
- Bookmark
- Subscribe
- Mute
- Subscribe to RSS Feed
- Permalink
- Report Inappropriate Content
I would just add a line to your script, the one in bold
SET ThousandSep=',';
SET DecimalSep='.';
DataIsland1: load * inline [
Parts Price
PartA 10
PartB 20
PartC 30
] (delimiter is spaces);
DataIsland2: load * inline [
Parts Currency
PartA USD
PartB USD
PartC EURO
] (delimiter is spaces);
DataIsland3: load * inline [
Currency Rate
EURO 1.09
] (delimiter is spaces);
Concatenate (DataIsland3) load 'USD' as Currency, 1 as Rate AutoGenerate 1;