Unlock a world of possibilities! Login now and discover the exclusive benefits awaiting you.
- Qlik Community
- :
- All Forums
- :
- QlikView App Dev
- :
- Re: Data Presentation in Pivot Chart
- Subscribe to RSS Feed
- Mark Topic as New
- Mark Topic as Read
- Float this Topic for Current User
- Bookmark
- Subscribe
- Mute
- Printer Friendly Page
- Mark as New
- Bookmark
- Subscribe
- Mute
- Subscribe to RSS Feed
- Permalink
- Report Inappropriate Content
Data Presentation in Pivot Chart
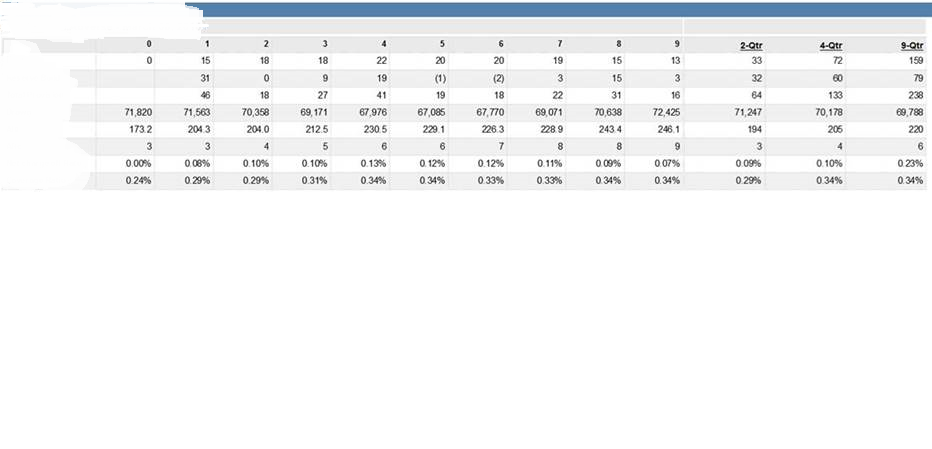
I have to show 2-QTR which will be the sum of 0,1,2 and 4-QTR which will be the sum of 0,1,2,3,4 fields and so on. I have got the calcs for this, but my question is how will I display it like the above format. Adding a new expression will not help because it will display the records as new row.
- Mark as New
- Bookmark
- Subscribe
- Mute
- Subscribe to RSS Feed
- Permalink
- Report Inappropriate Content
Create a new table with a new dimension in the script:
LOAD * INLINE [
OldDim, NewDim
0,0
1,1
2,2
3,3
4,4
5,5
6,6
7,7
8,8
9,9
0, 2_QTR
1, 2_QTR
2, 2_QTR
0, 4_QTR
1,4_QTR
2,4_QTR
3,4_QTR
4,4_QTR
5.4_QTR
etc...
]
Then use NewDim as dimension in your pivot table instead of OldDim
talk is cheap, supply exceeds demand
- Mark as New
- Bookmark
- Subscribe
- Mute
- Subscribe to RSS Feed
- Permalink
- Report Inappropriate Content
Hi,
Thanks for your reply. I think above solution will not work because 2-QTR,4-QTR,9-QTR are not straight sums. Somewhere these show averages and for some other metric these show sum and so on.
Moreover I am using ASOftable to get quarters