Unlock a world of possibilities! Login now and discover the exclusive benefits awaiting you.
- Qlik Community
- :
- All Forums
- :
- QlikView App Dev
- :
- Re: Data from Spreadsheet through transformation n...
- Subscribe to RSS Feed
- Mark Topic as New
- Mark Topic as Read
- Float this Topic for Current User
- Bookmark
- Subscribe
- Mute
- Printer Friendly Page
- Mark as New
- Bookmark
- Subscribe
- Mute
- Subscribe to RSS Feed
- Permalink
- Report Inappropriate Content
Data from Spreadsheet through transformation not displaying
Dear QV Experts,
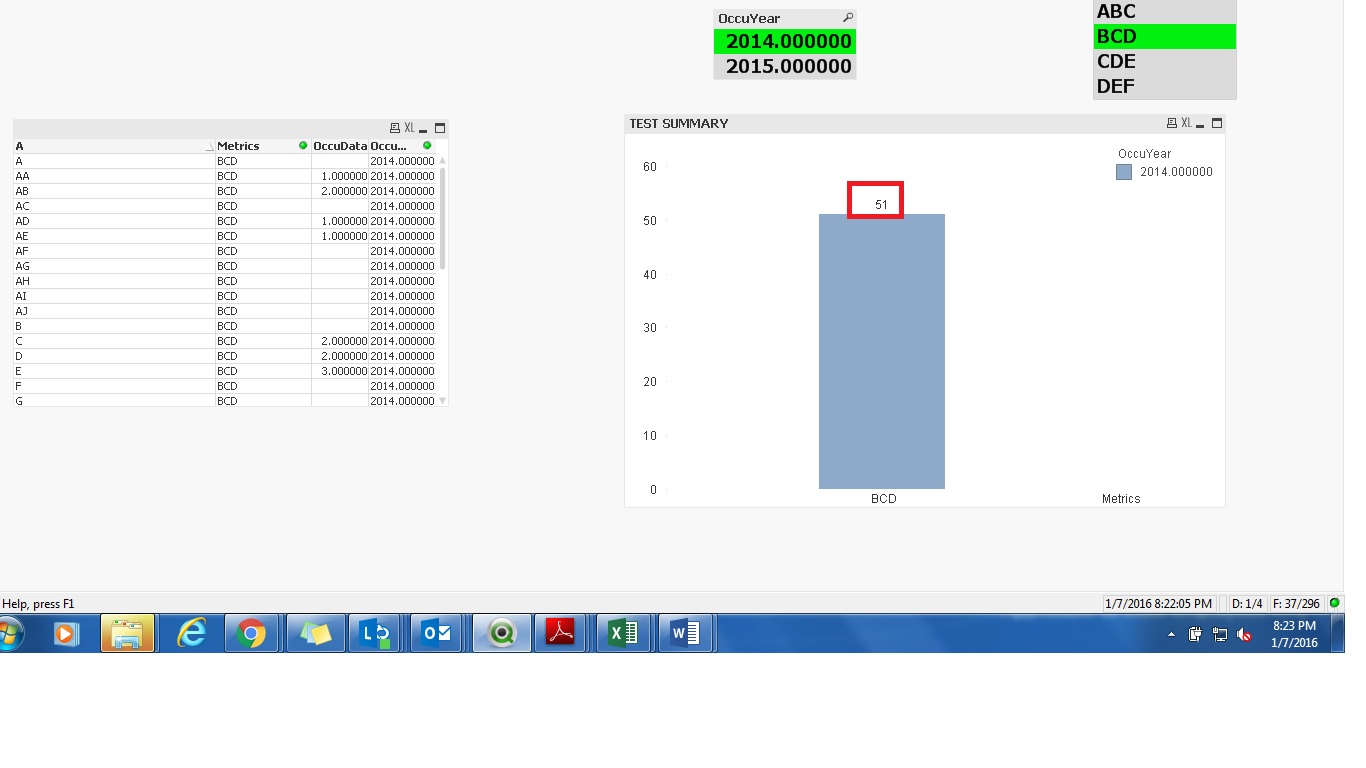
The input from spreadsheet, i am trying to transform the data & succeeded 50% but the total not displaying correctly selecting
Metrics. Few of the metrics are correct.
Can you please suggest me on this.
Enclosed the input sheet & qvw.
For selecting Year, 2014, & BCD then it should display,22 but displaying 51. Selected CDE, it should display 58 but in the chart displaying 77.
If selected ABC, for both the years 2014 & 2015, it is displaying correctly.
Appreciate your prompt response.
Thanks,
Sasi
- Tags:
- new_to_qlikview
Accepted Solutions
- Mark as New
- Bookmark
- Subscribe
- Mute
- Subscribe to RSS Feed
- Permalink
- Report Inappropriate Content
New Script:
OccuHealth:
CrossTable(A, OccuData, 2)
LOAD F1 as OccuYear,
[Row Labels] as Metrics,
A,
B,
C,
D,
E,
F,
G,
H,
I,
J,
K,
L,
M,
N,
O,
P,
Q,
R,
S,
T,
U,
V,
W,
X,
Y,
Z,
AA,
AB,
AC,
AD,
AE,
AF,
AG,
AH,
AI,
AJ
FROM
Test.xlsx
(ooxml, embedded labels, table is Sheet1, filters(
Transpose(),
Replace(1, top, StrCnd(null))
));
- Mark as New
- Bookmark
- Subscribe
- Mute
- Subscribe to RSS Feed
- Permalink
- Report Inappropriate Content
Try this...
- Mark as New
- Bookmark
- Subscribe
- Mute
- Subscribe to RSS Feed
- Permalink
- Report Inappropriate Content
New Script:
OccuHealth:
CrossTable(A, OccuData, 2)
LOAD F1 as OccuYear,
[Row Labels] as Metrics,
A,
B,
C,
D,
E,
F,
G,
H,
I,
J,
K,
L,
M,
N,
O,
P,
Q,
R,
S,
T,
U,
V,
W,
X,
Y,
Z,
AA,
AB,
AC,
AD,
AE,
AF,
AG,
AH,
AI,
AJ
FROM
Test.xlsx
(ooxml, embedded labels, table is Sheet1, filters(
Transpose(),
Replace(1, top, StrCnd(null))
));
- Mark as New
- Bookmark
- Subscribe
- Mute
- Subscribe to RSS Feed
- Permalink
- Report Inappropriate Content
Awesome Sunny!!! Thanks a lot.
- Mark as New
- Bookmark
- Subscribe
- Mute
- Subscribe to RSS Feed
- Permalink
- Report Inappropriate Content
No problem at all ![]()