Unlock a world of possibilities! Login now and discover the exclusive benefits awaiting you.
- Qlik Community
- :
- All Forums
- :
- QlikView App Dev
- :
- Data model Issue
- Subscribe to RSS Feed
- Mark Topic as New
- Mark Topic as Read
- Float this Topic for Current User
- Bookmark
- Subscribe
- Mute
- Printer Friendly Page
- Mark as New
- Bookmark
- Subscribe
- Mute
- Subscribe to RSS Feed
- Permalink
- Report Inappropriate Content
Data model Issue
Hi All,
Please find the attached excel file and Qvw file for reference of my tasks.please help us in the data model, the data is not reflecting when i am associate to year field but when associate to year and month the data got wrong..
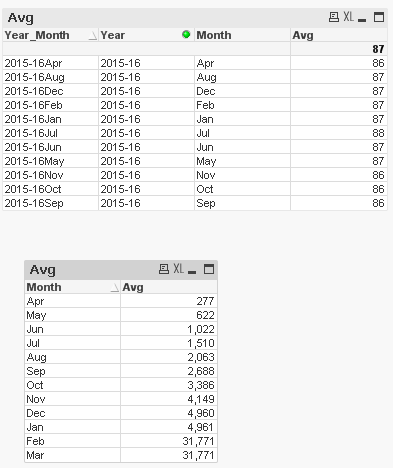
In the 1st tab should always display the previous month’s(technically) or latest month’s value(Feb 2016 from the sheet).
For ex :
SIM customer service score should display 87 and by clicking on it should show the YTD values (April 2015to Feb 2016)
Task 2 :
Some of the KPI’s you can see the values are cumulative means they are summed up every month
Ex: Customer contacts about drinking water quality
In this case let’s take it linearly
Target for the Year is 3000 so the target for months will be like this 3000/12
Apr- 250
May – 500
Jun – 750
Jul - 1000
Aug - 1250
Sep - 1500
Oct-1750
Nov-2000
Dec-2250
Jan – 2500
Feb - 2750
Mar-3000
This should be achieved for the below KPIs
Customer contacts about drinking water quality
Volume of water saved through water efficiency
Properties supplied by a single source of water
Internal flooding (incidents per 10000 properties)
- Mark as New
- Bookmark
- Subscribe
- Mute
- Subscribe to RSS Feed
- Permalink
- Report Inappropriate Content
What is calculation for Task 2 ?
- Mark as New
- Bookmark
- Subscribe
- Mute
- Subscribe to RSS Feed
- Permalink
- Report Inappropriate Content
Do you required output as shown below,
or Any other output ?