Unlock a world of possibilities! Login now and discover the exclusive benefits awaiting you.
- Qlik Community
- :
- All Forums
- :
- QlikView App Dev
- :
- Data points vanish from Scatter when Log Scale is ...
Options
- Subscribe to RSS Feed
- Mark Topic as New
- Mark Topic as Read
- Float this Topic for Current User
- Bookmark
- Subscribe
- Mute
- Printer Friendly Page
Turn on suggestions
Auto-suggest helps you quickly narrow down your search results by suggesting possible matches as you type.
Showing results for
Not applicable
2015-01-16
10:18 AM
- Mark as New
- Bookmark
- Subscribe
- Mute
- Subscribe to RSS Feed
- Permalink
- Report Inappropriate Content
Data points vanish from Scatter when Log Scale is Set
Hello!
Having a problem, best illustrated with two pictures.
Here's my scatter chart:
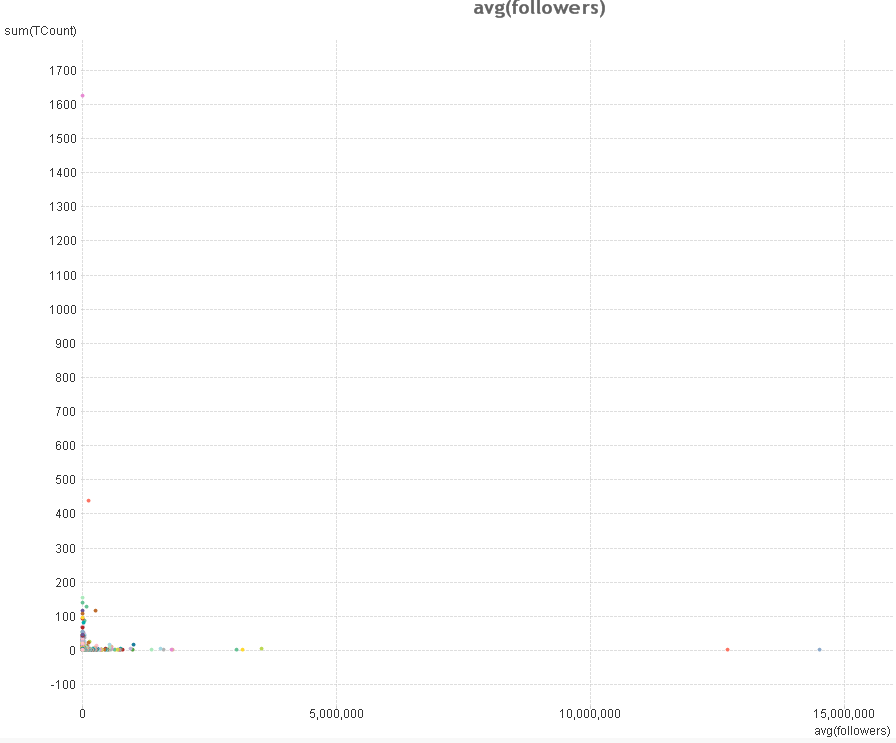
Data there, but useless as a chart. Log scale (as tried in Tableau to test) is a good solution, but when I select log scales:
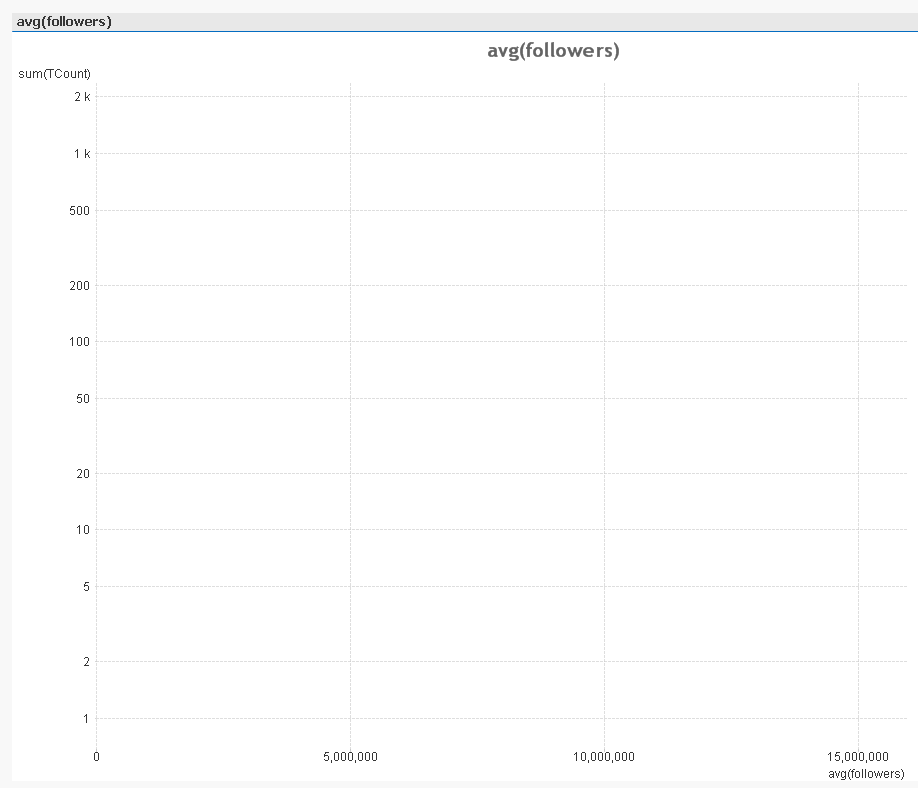
Everything's gone!
Any ideas?
- Tags:
- scatter_plot
740 Views
3 Replies
Anonymous
Not applicable
2015-01-17
08:54 AM
Author
- Mark as New
- Bookmark
- Subscribe
- Mute
- Subscribe to RSS Feed
- Permalink
- Report Inappropriate Content
Did you set log scale even for x-axis?
You can also try to set static Min-Max scale for both scales.
MVP
2015-01-17
10:34 AM
- Mark as New
- Bookmark
- Subscribe
- Mute
- Subscribe to RSS Feed
- Permalink
- Report Inappropriate Content
Please post sample app.
534 Views
Not applicable
2015-01-20
05:30 AM
Author
- Mark as New
- Bookmark
- Subscribe
- Mute
- Subscribe to RSS Feed
- Permalink
- Report Inappropriate Content
@Elena: thanks - tried it, and with sorted it (sort of).
The data now appears, and it isn't quite as beautiful as I had hoped, but
it's not bad.
Thanks to both.
On 17 January 2015 at 13:54, Elena Prandoni <qcwebmaster@qlikview.com>
534 Views