Unlock a world of possibilities! Login now and discover the exclusive benefits awaiting you.
- Qlik Community
- :
- All Forums
- :
- QlikView App Dev
- :
- Re: Date Problem
- Subscribe to RSS Feed
- Mark Topic as New
- Mark Topic as Read
- Float this Topic for Current User
- Bookmark
- Subscribe
- Mute
- Printer Friendly Page
- Mark as New
- Bookmark
- Subscribe
- Mute
- Subscribe to RSS Feed
- Permalink
- Report Inappropriate Content
Date Problem
Hi guys, my problem is:
- I have two tables: CLIENT and CALENDAR
- They are joined by YEAR_MONTH
- CLIENTE has a column called: INCLUSION_DATE
- In CALENDAR i have YEAR_MONTH, YEAR, MONTH, DAY, DATE
I would like to select YEAR=2016, MONTH=MAR and create a line chart that give me how many CLIENTs i have day by day of the whole selected month, from the day 1 to the 30.
My set analisys was:
count(
{
<INCLUSION_DATE={'<=$(=DATE)'}>
}
CLIENT)
It works when i select just one DATE. But when i select the month the chart show me nothing.
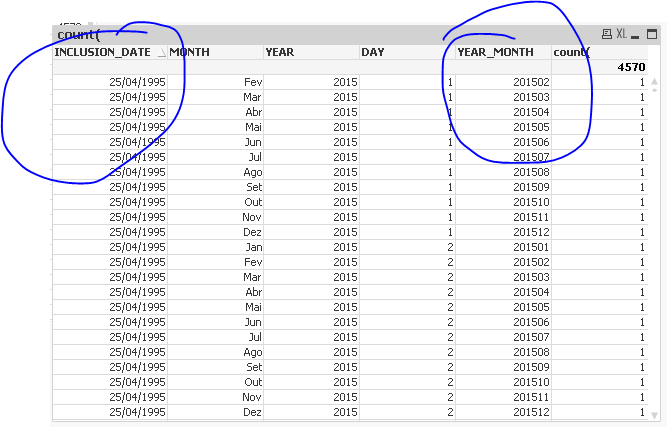
My expectation is someting like this:

- « Previous Replies
-
- 1
- 2
- Next Replies »
- Mark as New
- Bookmark
- Subscribe
- Mute
- Subscribe to RSS Feed
- Permalink
- Report Inappropriate Content
If you have already selected Year and Month, I don't think you would need Set analysis:
Count(CLIENT)
- Mark as New
- Bookmark
- Subscribe
- Mute
- Subscribe to RSS Feed
- Permalink
- Report Inappropriate Content
No... CLIENT and CALENDAR are joined by YEAR_MONTH.
With month selected and count(CLIENT) my chart will show:
- DAY from CALENDAR as Dimension: the same count value all days from the month
- DAY extracted from INCLUSION_DATE as Dimension: how many CLIENT was added in each day.
And what i want is: how many CLIENT i have until each day.
- Mark as New
- Bookmark
- Subscribe
- Mute
- Subscribe to RSS Feed
- Permalink
- Report Inappropriate Content
count(
{
<INCLUSION_DATE={'<=$(=Max(DATE))'}>
}
CLIENT)
- Mark as New
- Bookmark
- Subscribe
- Mute
- Subscribe to RSS Feed
- Permalink
- Report Inappropriate Content
count(
{
<INCLUSION_DATE={"<=$(=max(DATE))"}, Month=>
}
CLIENT)
- Mark as New
- Bookmark
- Subscribe
- Mute
- Subscribe to RSS Feed
- Permalink
- Report Inappropriate Content
Putting "Month=" the chart shows all dates from selected year.
Putting max(DATE) the chart shows, for all dates, the same value, the value of the max date: 31/12/2016
- Mark as New
- Bookmark
- Subscribe
- Mute
- Subscribe to RSS Feed
- Permalink
- Report Inappropriate Content
Putting max(DATE) the chart shows, for all dates, the same value, the value of the max date: 31/03/2016
- Mark as New
- Bookmark
- Subscribe
- Mute
- Subscribe to RSS Feed
- Permalink
- Report Inappropriate Content
Can you share your app?
Thanks!
- Mark as New
- Bookmark
- Subscribe
- Mute
- Subscribe to RSS Feed
- Permalink
- Report Inappropriate Content
thats my app!
Thanks to all for your support!
- Mark as New
- Bookmark
- Subscribe
- Mute
- Subscribe to RSS Feed
- Permalink
- Report Inappropriate Content
Can you check your sample. The YEAR_MONTH and INCLUSION_DATE are not aligning up properly here
- « Previous Replies
-
- 1
- 2
- Next Replies »