Unlock a world of possibilities! Login now and discover the exclusive benefits awaiting you.
Announcements
NEW: Seamless Public Data Sharing with Qlik's New Anonymous Access Capability:
TELL ME MORE!
- Qlik Community
- :
- All Forums
- :
- QlikView App Dev
- :
- Date shows as 1900
Options
- Subscribe to RSS Feed
- Mark Topic as New
- Mark Topic as Read
- Float this Topic for Current User
- Bookmark
- Subscribe
- Mute
- Printer Friendly Page
Turn on suggestions
Auto-suggest helps you quickly narrow down your search results by suggesting possible matches as you type.
Showing results for
Specialist II
2020-10-19
04:11 PM
- Mark as New
- Bookmark
- Subscribe
- Mute
- Subscribe to RSS Feed
- Permalink
- Report Inappropriate Content
Date shows as 1900
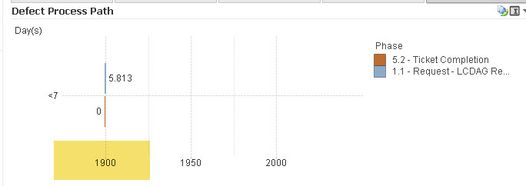
This date field works fine everywhere else but in this new chart, it shows as 1900. I added date#() in the script but it didn't fix it.
Script:
date("ADJ_GOVERNANCE_PHASE_START_DATE", 'MM/DD/YYYY') as ADJ_GOVERNANCE_PHASE_START_DATE,
Dashboard displays all as 1900
Chart Dimensions: (ADJ_GOVERNANCE_PHASE_START_DATE)
Chart expression: if(isnull(ADJ_GOVERNANCE_PHASE_END_DATE),ADJ_GOVERNANCE_PHASE_START_DATE-date(today()),ADJ_GOVERNANCE_PHASE_TAT)
1,803 Views
- « Previous Replies
-
- 1
- 2
- Next Replies »
11 Replies
MVP
2020-10-22
07:39 PM
- Mark as New
- Bookmark
- Subscribe
- Mute
- Subscribe to RSS Feed
- Permalink
- Report Inappropriate Content
@cbaqir What is the requirement of chart? Because in expression and dimension both place you have used that Date which is causing that issue.
194 Views
Specialist II
2020-10-23
10:23 AM
Author
- Mark as New
- Bookmark
- Subscribe
- Mute
- Subscribe to RSS Feed
- Permalink
- Report Inappropriate Content
185 Views
- « Previous Replies
-
- 1
- 2
- Next Replies »
