Unlock a world of possibilities! Login now and discover the exclusive benefits awaiting you.
- Qlik Community
- :
- All Forums
- :
- QlikView App Dev
- :
- Re: Dealing with 0's / -
- Subscribe to RSS Feed
- Mark Topic as New
- Mark Topic as Read
- Float this Topic for Current User
- Bookmark
- Subscribe
- Mute
- Printer Friendly Page
- Mark as New
- Bookmark
- Subscribe
- Mute
- Subscribe to RSS Feed
- Permalink
- Report Inappropriate Content
Dealing with 0's / -
Hi All,
I'm hoping someone might be able to help me.
I have a table that is working out a variance between 2 sets of data that have been standardised to a rate per 1,000.
The expression I am using is:
=(
(
(
(
sum({<[Main Programme] = {'Neurology'}, [Chapter] = {'Neurological - Conditions'}, POD = {'Elective'}, Year = {'2018-19'}>} [Cost]) //Calculate the current year value for Neurology
/count(distinct {<Year = {'2018-19'}>}Period) //Divide by the current number of months
)
*12 //Times by 12 to get a straight line projection
)
/sum({<Year = {'2018-19'}>}Pops) //Divide this by the current cohort
)*1000 // Times by 1000 to get the RPT
)
-sum({<Year = {'2015-16'}, [Main Programme] = {'Neurology'}, [Chapter] = {'Neurological - Conditions'}, POD = {'Elective'}>}[Best 5]) //Minus the Target vale to find the variance
The problem that I am facing is that I have 9 Dimensions but 3 are blank for the first sum. This is causing the equation to set them as '-' and to be excluded from the final results displayed.

Un-checking the 'Suppress Zero-Values' checkbox causes the table to display every available item regardless of the set analysis of the expression.
Does anyone know how I can get the table to display the 9 values, some as 0 without showing everything (I have 100+ programmes broken down into main programmes and chapters).
Any help you can offer is greatly appreciated.
Accepted Solutions
- Mark as New
- Bookmark
- Subscribe
- Mute
- Subscribe to RSS Feed
- Permalink
- Report Inappropriate Content
- Mark as New
- Bookmark
- Subscribe
- Mute
- Subscribe to RSS Feed
- Permalink
- Report Inappropriate Content
Would you be able to share a sample to test it out?
- Mark as New
- Bookmark
- Subscribe
- Mute
- Subscribe to RSS Feed
- Permalink
- Report Inappropriate Content
Hi Sunny,
Please find attached a sample to test out.
Many thanks for your help with this.
- Mark as New
- Bookmark
- Subscribe
- Mute
- Subscribe to RSS Feed
- Permalink
- Report Inappropriate Content
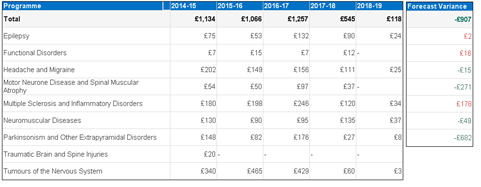
Are you after a view like this?
- Mark as New
- Bookmark
- Subscribe
- Mute
- Subscribe to RSS Feed
- Permalink
- Report Inappropriate Content
Ooh yes, that's it.
Is it the match function that is doing this?
Thank you very much.
- Mark as New
- Bookmark
- Subscribe
- Mute
- Subscribe to RSS Feed
- Permalink
- Report Inappropriate Content
So, I made few changes
1) Used a calculated dimension
=If(Match(Programme, 'Epilepsy', 'Functional Disorders', 'Headache and Migraine', 'Motor Neurone Disease and Spinal Muscular Atrophy', 'Multiple Sclerosis and Inflammatory Disorders',
'Neuromuscular Diseases', 'Parkinsonism and Other Extrapyramidal Disorders', 'Traumatic Brain and Spine Injuries', 'Tumours of the Nervous System'), Programme)
2) Checked 'Suppress When Value is Null' on the dimensions tab
3) Unchecked 'Suppress Zero-Values' from the Presentation tab
- Mark as New
- Bookmark
- Subscribe
- Mute
- Subscribe to RSS Feed
- Permalink
- Report Inappropriate Content
Brilliant,
Thank you so much for your help with this Sunny.